


Key takeaways:
- A Gantt chart is a horizontal bar chart that illustrates a project schedule, showing the start and end dates of individual tasks or activities and their dependencies.
- It allows project managers to visualize the project’s critical path, the sequence of tasks that must be completed on time to keep the project on schedule.
- A Gantt chart is best used in linear projects where tasks follow a sequential order.
The first time I had to present a multiphase project to a stakeholder, a task list didn’t cut it. I needed one visual that showed the project timeline, task sequence, and key dependencies without making me narrate every detail. A Gantt chart gave me that view, helping me show how one task affected another and where delays could ripple through the project.
Despite the name, the earliest version of this kind of chart is often credited to Polish engineer Karol Adamiecki, who developed a scheduling tool called the harmonogram in the 1890s. Henry Gantt later popularized a similar version in the early 1900s, which is why the format became known as the Gantt chart.
In this guide, I’ll explain what a Gantt chart is, when to use one, and how to build one with easy-to-follow examples and templates.
What is a Gantt chart?
A Gantt chart is a visual scheduling tool that lays out tasks against a timeline using horizontal bars. The length of each bar represents the duration of the task, and connecting lines show which tasks depend on others finishing first. This gives teams a shared view of what needs to be done and in what order.
Why project managers use Gantt charts
Project managers use Gantt charts because they make complex schedules easier to understand and manage. Instead of reviewing separate task lists and status updates, you can see the entire project timeline in one place.
- Visualize project schedules: See task start and end dates alongside durations on a single timeline.
- Track project progress: Compare timelines with actual progress to spot potential delays in advance.
- Monitor milestones: Keep important deadlines visible and keep deliverables on track.
- Communicate with stakeholders: Share a visual project overview that is easier to understand than spreadsheets or task lists.
- Identify bottlenecks early: Quickly see which tasks could delay the project if they fall behind schedule and how it affects the rest of the project.
How a Gantt chart works
Each horizontal bar in a Gantt chart represents a task, with its position and length indicating when it starts, when it ends, and how long it will take to complete.
Key components of a Gantt chart
Gantt charts use a mix of bars, lines, markers, shading, and labels to communicate project information quickly. These visual symbols help teams understand what needs to happen, when it needs to happen, who owns it, and which tasks depend on others.
- Tasks: The individual activities required to complete the project. These appear on the left side of the chart.
- Timeline: The horizontal scale that shows days, weeks, or months, depending on the project’s duration.
- Task duration: The length of each bar indicates how much time is allocated for a task.
- Dependencies: Lines connecting tasks show relationships between activities and identify work that must be completed before another task can begin.
- Milestones: Important project checkpoints represented by diamond-shaped markers on the timeline.
- Progress indicators: Shaded sections within task bars show how much work has been completed.
- Assignees: Many modern Gantt charts display the team member or department responsible for each task.
Picture this: Take a website launch as an example. Design is listed as a task with a two-week bar. Development sits right after it, connected by a dependency line since coding can’t start until the designs are final, and any delay in design could push back the entire project schedule.
A milestone marks the launch date at the end. As work progresses, the bars fill in. If the design runs three days late, the dependency line immediately shows that it could back development shifts, too. This makes it clear that any delay in design could push back the entire project schedule
When to use a Gantt chart (& when not to)
Gantt charts are powerful planning tools, but they are not the best solution for every project. They work best when schedules, dependencies, and deadlines need close monitoring. For simpler projects or fast-moving workflows, a different tool may be easier to manage.
| Your project has multiple phases and interconnected tasks. | Your project consists of a few independent tasks with no dependencies. |
| Task sequencing is important, and delays could affect future work. | You only need a basic to-do list or checklist. |
| You need to track deadlines, milestones, and progress over time. | You want a quick overview of major dates without task-level details. |
| The project spans several weeks or months. | The project is short-term and doesn’t require detailed scheduling. |
Gantt Chart vs other project tools
Besides Gantt charts, project managers also use Kanban boards, project roadmaps, and PERT charts to track progress. The comparison table below compares their key features and use cases.
| Gantt chart | ||||
| Timeline | ||||
| Kanban Board | ||||
| PERT Chart |
- Timeline views look similar to Gantt charts but are lighter on structure. They show tasks across dates without enforcing dependencies or critical path logic. They work well for simple scheduling or content calendars where sequencing matters less than knowing what’s due when.
- Kanban boards organize work as cards moving across columns commonly labeled as To Do, In Progress, and Done. They’re built for teams prioritizing flow over fixed schedules. If your work is continuous, hard to predict upfront, or sprint-based, Kanban is a better fit. Gantt charts, by contrast, assume you know the tasks, sequence, and duration before the project starts.
- PERT charts also map task dependencies, but they represent tasks as nodes in a network diagram rather than bars on a timeline. PERT is useful when task durations are uncertain, and you need to calculate best-case, worst-case, and expected timelines.
How to build a simple Gantt chart
Creating a Gantt chart is easier than it looks, especially if you’re using project management software that can generate one from your existing schedule.
Whether you’re building it manually in a spreadsheet or switching to a Gantt view inside a project management tool, the goal is the same: map your project tasks on a timeline so you can see what needs to happen, when it needs to happen, and how tasks connect.
Here’s how to put one together:
1. List your tasks
Write every task the project requires, in the order they need to happen. For large deliverables, break them into smaller activities. For example, a website redesign project might include planning, design, development, testing, and launch tasks.
2. Estimate task durations
Determine how long each task will take to complete. Use estimates based on available resources and previous project experience.
3. Set task start and end dates
Assign dates to each task based on your deadline and resources. These dates will determine the length and position of each task bar on the chart.
4. Identify dependencies
Go through your task list and note which tasks can’t start until another task finishes. These connections will shape your timeline more than anything else.
5. Plot the tasks on a timeline
In a spreadsheet, create a column for each day, week, or month, depending on your project length. To form the bars, shade the cells that fall within each task’s start and end dates.
6. Mark your milestones
Add a marker, a different color or symbol, for any project checkpoints, such as a major deliverable, approval date, or a target deadline.
7. Assign owners
Add a column for the person or team responsible for each task so everyone understands their role and accountability within the project.
8. Update it as work progresses.
Once work begins, update task completion percentages and adjust schedules as needed. Most projects set a weekly cadence to update progress.
Gantt chart templates & examples
I’ve pulled together Gantt chart examples from top project management platforms. Whether you’re building your first chart or evaluating which tool fits your team, use these Gantt chart templates as your starting point.
1. Event campaign Gantt chart by monday work management
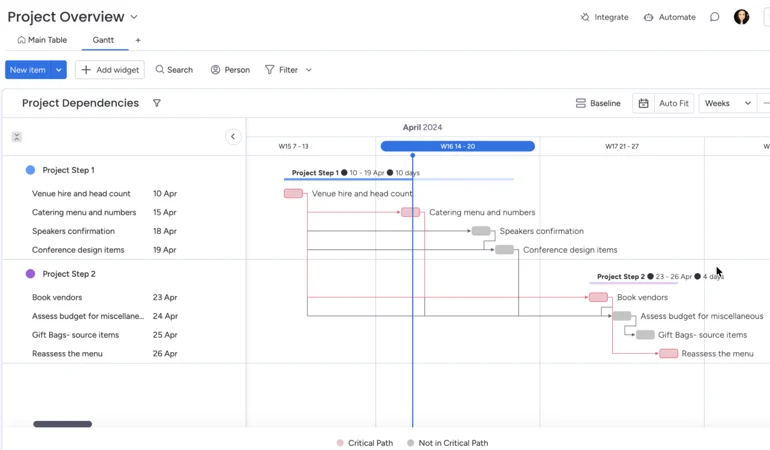
What stands out to me in monday’s Gantt view is the emphasis on dependencies rather than task durations alone. The project example uses two phases with connected activities, making it easy to trace how work flows from venue planning to vendor management. Colored dependency lines and critical path indicators help distinguish tasks that directly influence the schedule.
2. Construction Gantt chart by ClickUp
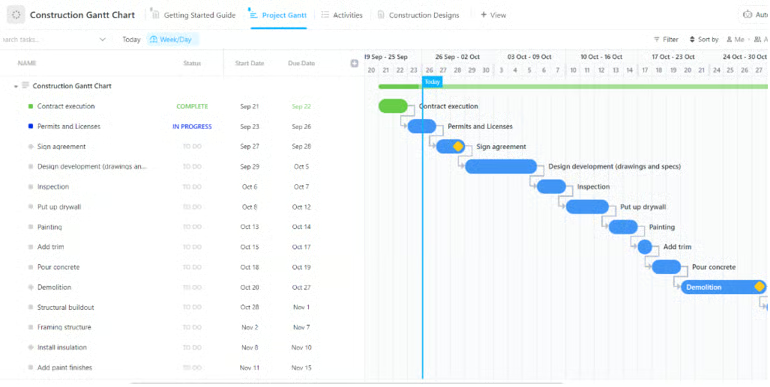
I like how ClickUp’s Gantt chart places the task list and schedule side by side, which makes it easy to connect dates with the timeline. In this construction Gantt view, each task appears as a horizontal bar with dependency lines showing the order of work from contract execution through demolition. Status labels such as Complete, In Progress, and To Do add context without cluttering the chart.
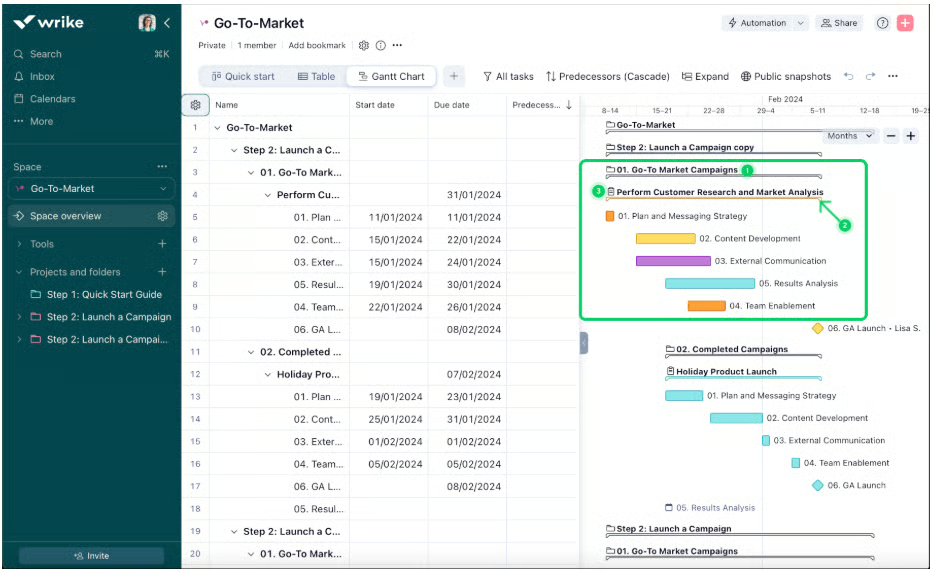
3. Go-To-Market strategy Gantt chart by Wrike
4. Gantt chart dashboard widget by Smartsheet
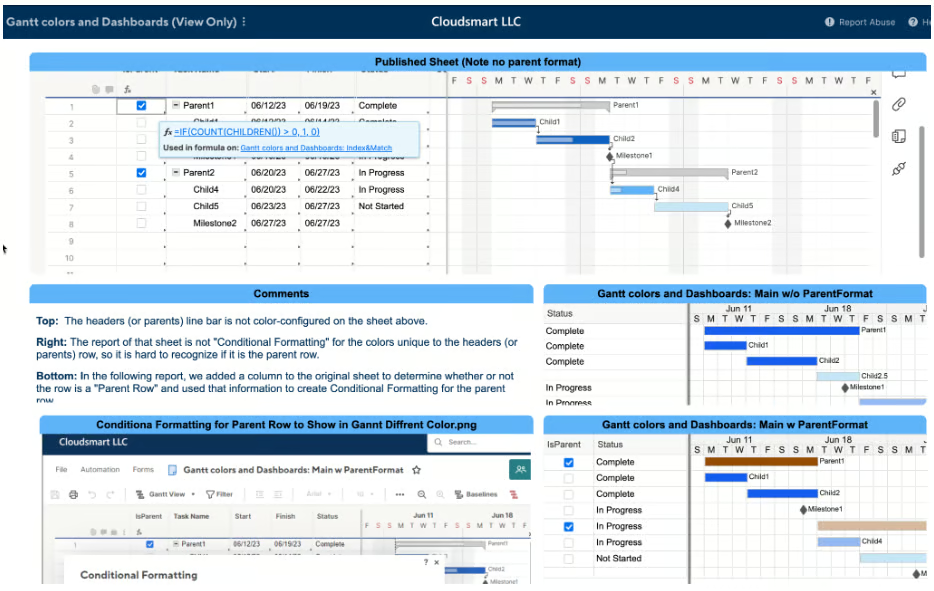
Smartsheet’s Gantt view combines spreadsheet-style data with a Gantt chart widget, which feels familiar if you already work in spreadsheets. The example organizes parent tasks, child tasks, and milestones in a hierarchy, with corresponding bars displayed across the timeline. Different colors separate project phases and statuses, making it easier to distinguish related work.
FAQs
What is the difference between a timeline and a Gantt chart?
A timeline shows you what’s scheduled and when. That’s enough for any situation where tasks run independently, and the main question is simply “what’s due this week.” A Gantt chart shows not just when tasks happen but how they connect, who owns each task, and which tasks lie on the critical path.
Is a Gantt chart still used today?
Yes, Gantt charts remain one of the most widely used project management tools. Modern project management software has expanded its capabilities with real-time updates, dependency tracking, resource management, and customizable Gantt chart templates.
How do you read a Gantt chart?
Start by reviewing the tasks listed on the left side of the chart. Then look at the horizontal bars to see when each task starts, ends, and how long it lasts. Dependency lines and milestones help you understand task relationships and deadlines.