


Grafana is one of the most popular open-source tools for visualizing data generated by numerous sources (such as Google Sheets, Amazon Timestream, Elasticsearch and nearly any database). With dynamic, interactive dashboards, this Go and Typescript-built platform makes it possible for you to query, visualize and monitor metrics.
Open source: Must-read coverage
- Debian vs Ubuntu: Which Linux Distro Fits Your Needs Best?
- Ubuntu Server: A Cheat Sheet
- Llama 3 Cheat Sheet: A Complete Guide for 2024
- CISA Report Finds Most Open-Source Projects Contain Memory-Unsafe Code
Grafana is available for installation on Linux, macOS, and Windows. You can deploy Grafana on a local data center or a third-party cloud host. I’m going to walk you through the process of getting this system up and running on AlmaLinux, which is available for both bare-metal installations or from your cloud host of choice.
SEE: Checklist: How to manage your backups (TechRepublic Premium)
What you’ll need
To make this work, you’ll need a running instance of AlmaLinux and a user with sudo privileges.
Let’s get to work.
How to add the Grafana repository
The first thing to be done is to add the necessary Grafana repository. Log into your AlmaLinux instance and issue the command:
sudo nano /etc/yum.repos.d/grafana.repo
Paste the following into the new file:
[grafana]
name=grafana
baseurl=https://packages.grafana.com/oss/rpm
repo_gpgcheck=1
enabled=1
gpgcheck=1
gpgkey=https://packages.grafana.com/gpg.key
sslverify=1
sslcacert=/etc/pki/tls/certs/ca-bundle.crt
Save and close the file.
How to install Grafana
Run a system update with the command:
sudo dnf update -y
When that completes, install Grafana with the command:
sudo dnf install grafana -y
When the installation finishes, start and enable Grafana with:
sudo systemctl enable --now grafana-server
Next, we need to open the necessary port for Grafana with the following commands:
sudo firewall-cmd --add-port=3000/tcp --permanent
sudo firewall-cmd --reload
How to access Grafana
With Grafana installed, it’s time to access the dashboard. Open a web browser and point it to http://SERVER:3000 (where SERVER is the IP address of the hosting server). You’ll be presented with the login screen (Figure A), where you’ll use the credentials admin/admin.
Figure A
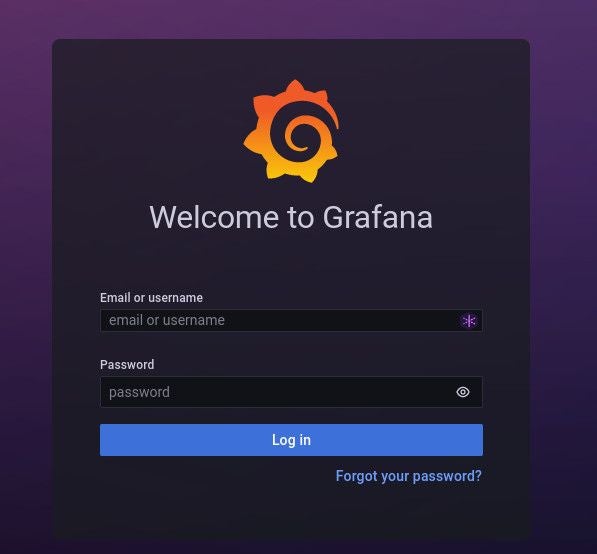
The Grafana login window requires the default username/password of admin/admin.
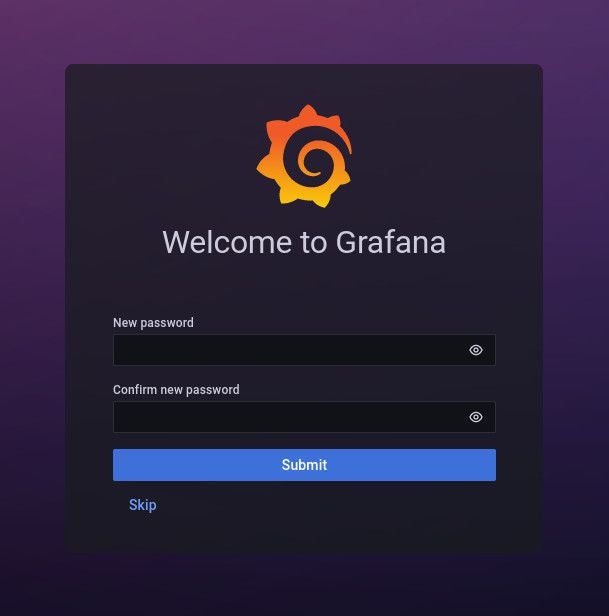
Click Login and you’ll be immediately prompted to change the default password (Figure B).
Figure B
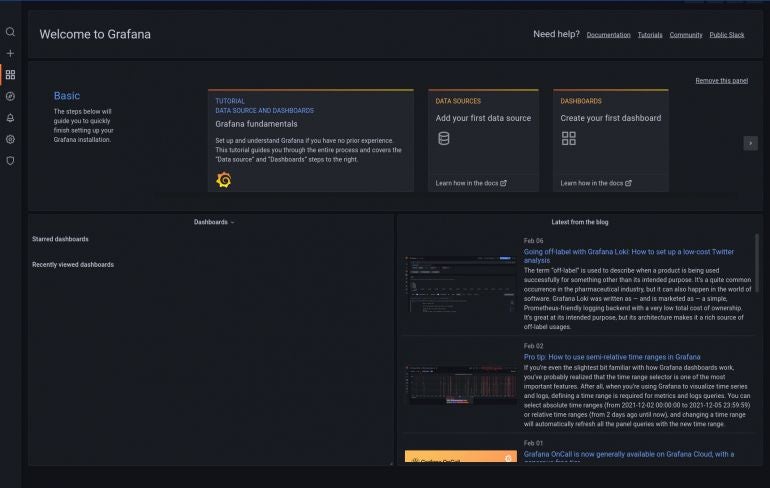
Once you’ve successfully changed the admin password, you’ll be greeted by the default Grafana page (Figure C), where you can start building dashboards and importing data.
Figure C
And that’s all there is to installing Grafana on AlmaLinux. With this combination, you cannot go wrong as a means to view and interact with your data. Add your first data source and enjoy that newfound visualization power.
Subscribe to TechRepublic’s How To Make Tech Work on YouTube for all the latest tech advice for business pros from Jack Wallen.