


This article is also available as a PDF download.
By Garr Reynolds
- #1: Keep it simple
- #2 Limit bullet points and text
- #3: Limit transitions and builds (animation)
- #4: Use high quality graphics
- #5: Have a visual theme but avoid using PowerPoint templates
- #6: Use appropriate charts
- #7: Use color well
- #8: Choose your fonts well
- #9: Use video or audio
- #10: Spend time in the slider sorter
#1: Keep it simple
PowerPoint uses slides with a horizontal, or Landscape,
orientation. The software was designed as a convenient way to display graphical
information that would support the speaker and supplement the presentation. The
slides themselves were never meant to be the star of the show. (The star, of
course, is your audience.) People came to hear you and be moved or informed (or
both) by you and your message. Don’t let your message and your ability to tell
a story get derailed by slides that are unnecessarily complicated, busy, or
full of what Edward Tufte calls “chart
junk.” Nothing in your slide should be superfluous, ever.
Your slides should have plenty of white space, or negative
space. Do not feel compelled to fill empty areas on your slide with your logo
or other unnecessary graphics or text boxes that do not contribute to better
understanding. The less clutter you have on your slide, the more powerful your
visual message will become.
#2 Limit bullet points and text
Your presentation
is for the benefit of the audience. But boring an audience with bullet point
after bullet point is of little benefit to them. Which brings us to the issue
of text. The best slides may have no text at all. This may sound insane given
the dependency of text slides today, but the best PowerPoint slides will be
virtually meaningless without the narration (that is you). Remember, the slides
are meant to support the narration of the speaker, not make the speaker
superfluous.
Many people often
say something like this: “Sorry I missed your presentation. I hear it was
great. Can you just send me your PowerPoint slides?” But if they are good
slides, they will be of little use without you. Instead of a copy of your
PowerPoint slides, it is far better to prepare a written document that
highlights your content from the presentation and expands on that content.
Audiences are much better served receiving a detailed, written handout as a
takeaway from the presentation, rather than a mere copy of your PowerPoint
slides. If you have a detailed handout or publication for the audience to be
passed out after your talk, you need not feel compelled to fill your
PowerPoint slides with a great deal of text.
We’ll talk more
about this in the delivery section below, but as long as we are talking about
text, please remember to never, ever turn your back on the audience and read
text from the slide word for word.
|
|
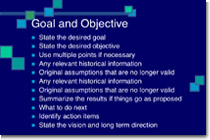 |
| This slide is not unusual, but it is not a visual aid, it is more like an eye chart. |
|
|
 |
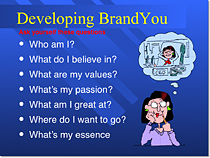
| Try to avoid text-heavy (and sleep inducing) slides like this one. |
|
|
 |
| Aim for something like this simple slide above. |
|
|
 |
| And this is even better. |
#3: Limit transitions and builds (animation)
Use object builds and slide transitions judiciously. Object
builds (also called animations), such as bullet points, should not be animated
on every slide. Some animation is a good thing, but stick to the most subtle
and professional (similar to what you might see on the evening TV news broadcast).
A simple Wipe Left-to-Right (from the Animations menu) is good for
a bullet point, but a Move or Fly, for example, is too tedious and slow (and
yet, is used in many presentations today). Listeners will get bored quickly if
they are asked to endure slide after slide of animation. For transitions
between slides, use no more than two or three types of transition effects and
do not place transition effects between all slides.
#4: Use high quality graphics
Use high quality
graphics, including photographs. You can take your own high quality photographs
with your digital camera, purchase professional stock photography, or use the
plethora of high quality images available online. (But be cautious of copyright
issues.) Never simply stretch a small, low-resolution photo to make it fit your
layout–doing so will degrade the resolution even further.
Avoid using
PowerPoint Clip Art or other cartoonish line art.
Again, if it is included in the software, your audience has seen it a million
times before. It may have been interesting in 1993, but today the inclusion of
such clip art often undermines the professionalism of the presenter. There are
exceptions, of course, and not all PowerPoint art is dreadful, but use it
carefully and judiciously.
I often use images
of people in my slides, as photography of people tends to help the audience
connect with the slide on a more emotional level. If the photographic image is
secondary in importance, then I decrease the opacity and add a Gaussian Blur or
motion filter in Photoshop. If the photographic image is the primary area I
want the audience to notice (such as a picture of a product), then the image
can be more pronounced and little (or no) text is needed.
|
|
 |
| Try to avoid cheesy clip art like this. |
|
|
 |
| This edited stock photograph is more effective and professional. |
|
|
 |
| In this title slide, the image is primary. |
|
|
 |
| In this slide from the same presentation, the image is secondary and pushed to the back by editing it first in Photoshop. |
#5: Have a visual theme but avoid using PowerPoint templates
You clearly need a consistent visual theme throughout your
presentation, but most templates included in PowerPoint have been seen by your
audience countless times (and besides, the templates are not all that great to
begin with). Your audience expects a unique presentation with new (at least to
them) content; otherwise, why would they be attending your talk? No audience
will be excited about a cookie-cutter presentation, and we must therefore shy
away from any supporting visuals, such as the ubiquitous PowerPoint Design
Template, that suggests your presentation is formulaic or prepackaged.
You can make your own background templates, which will be
more tailored to your needs. You can then save the PowerPoint file as a Design
Template (.pot) and the new template will appear among your standard Microsoft
templates for your future use. You can also purchase professional templates online.
#6: Use appropriate charts
Always be asking yourself, “How much detail do I
need?” Presenters are usually guilty of including too much data in their
onscreen charts. There are several ways to display your data in graphic form;
here are a few things to keep in mind:
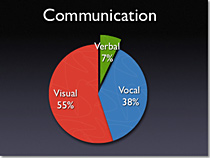
Pie charts. Used
to show percentages. Limit the slices to 4-6 and contrast the most important
slice either with color or by exploding the slice.
|
|
 |
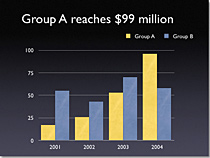
Vertical bar charts.
Used to show changes in quantity over time. Best if you limit the bars to 4-8.
|
|
 |
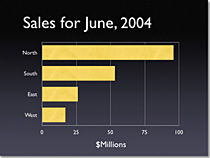
Horizontal bar charts.
Used to compare quantities. For example, comparing sales figures among the four
regions of the company.
|
|
 |
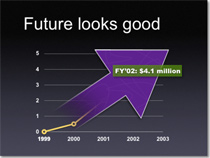
Line charts. Used
to demonstrate trends. For example, here is a simple line chart showing that
our sales have gone up every year. The trend is good. The arrow comes in later
to underscore the point: Our future looks good!
|
|
 |
In general, tables are well suited for side-by-side
comparisons of quantitative data.
|
|
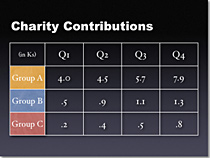 |
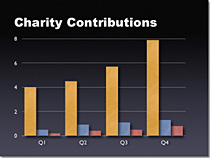
However, tables can lack impact on a visceral level. If you
want to show how your contributions are significantly higher than two other
parties, for example, it would be best to show that in the form of a bar chart
(below). But if you’re trying to downplay
the fact that your contributions are lower than others, a table will display
that information in a less dramatic or emotional way.
|
|
 |
#7: Use color well
Color evokes feelings. Color is emotional. The right color
can help persuade and motivate. Studies show that color usage can increase
interest and improve learning comprehension and retention.
You
do not need to be an expert in color theory, but it’s good for business
professionals to know at least a bit on the subject. Colors can be divided into
two general categories: cool (such as blue and green) and warm (such as orange
and red). Cool colors work best for backgrounds, as they appear to recede away
from us into the background. Warm colors generally work best for objects in the
foreground (such as text) because they appear to be coming at us. It is no
surprise, then, that the most ubiquitous PowerPoint slide color scheme includes
a blue background with yellow text. You do not need to feel compelled to use
this color scheme, although you may choose to use a variation of those colors.
If you will be presenting in a dark room
(such as a large hall), a dark background (dark blue, gray, etc.) with white or
light text will work fine. But if you plan to keep most of the lights on (which
is highly advisable), a white background with black or dark text works much
better. In rooms with a good deal of ambient light, a screen image with a dark
background and light text tends to washout, but dark text on a light background
will maintain its visual intensity a bit better.
Learn more:
-
PresentationPro.com has some great Flash tutorials, including one
on color. -
Go to the CreativePro.com to learn more about
color. -
Dummies.com has a good short article on how to use
the Color Schemes in PowerPoint.
#8: Choose your fonts well
Fonts communicate subtle messages in and of themselves,
which is why you should choose fonts deliberately. Use the same font set
throughout your entire slide presentation and use no more than two
complementary fonts (e.g., Arial and Arial Bold). Make sure you know the
difference between a serif font (e.g., Times New Roman) and a sans-serif font (e.g.,
Helvetica or Arial).
Serif fonts were designed to be used in documents filled
with lots of text. They’re said to be easier to read at small point sizes, but
for onscreen presentations, the serifs tend to get lost due to the relatively
low resolution of projectors. Sans- serif fonts are generally best for
PowerPoint presentations, but try to avoid the ubiquitous Helvetica. I often
choose to use Gill Sans, as it is somewhere in between a serif and a sans-serif
font and is professional yet friendly and “conversational.”
Regardless of what font you choose, make sure the text can be read from the
back of the room.
|
|
 |
| Times |
|
|
 |
| Arial black; Arial |
#9: Use video or audio
Use video and audio when appropriate. Using video clips to
show concrete examples promotes active cognitive processing, which is the
natural way people learn. You can use video clips within PowerPoint without
ever leaving the application or tuning on a VCR. Using a video clip not only
will illustrate your point better, it will also serve as a change of pace,
thereby increasing the interest of your audience.
You can use audio clips (such as interviews) as well. But
avoid using the cheesy sound effects that are included in PowerPoint (such as
the sound of a horn or applause when transitioning slides). The use of
superfluous sound effects attached to animations is a sure way to lose
credibility with your audience.
#10: Spend time in the slider sorter
According to the Segmentation Principle of multimedia
learning theory, people comprehend better when information is presented in
small chunks or segments. By getting out of the Slide view and into the Slide
Sorter view, you can see how the logical flow of your presentation is
progressing. In this view, you may decide to break up one slide into, say, two
or three slides so that your presentation has a more natural and logical flow
or process. You’ll also be able to capture more of the gestalt of your entire
presentation from the point of view of your audience. You will be able to
notice more extraneous pieces of visual data that can be removed to increase
visual clarity and improve communication.
|
|
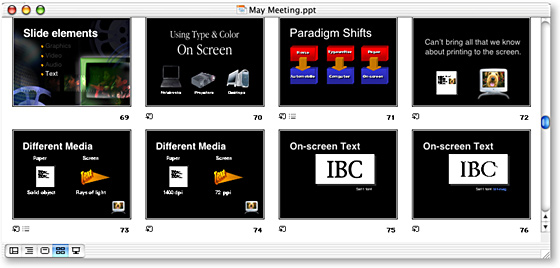 |
| The Slide Sorter view in PowerPoint |
Garr Reynolds is
currently Associate Professor of Management at Kansai Gaidai
University, where he teaches Marketing, Global Marketing, and Multimedia
Presentation Design. Garr is active in the Japanese community and can often be
found presenting on subjects concerning design, branding, and effective
corporate communications. In addition to his Web site, he maintains a blog, Presentation Zen, which offers
insights into professional presentation design.