I received an email from an employee in the United States Central Command inquiring about how to use Microsoft Project to track personnel on a military base and monitor resource levels as units deactivate during a base closing. The goal was to measure the total number of personnel at any given point in time and track the resources as the base downsizes.
I developed a quick resource management model in Microsoft Project 2007 that will produce this information. Since Microsoft Project supports resource assignments and resource pools, developing an ongoing model was relatively easy. This example creates a work breakdown structure (WBS) that is comprised of teams or units that are allocated to different tasks.
This TechRepublic gallery is also available as an IT Leadership blog post.
Step 1: Develop the WBS
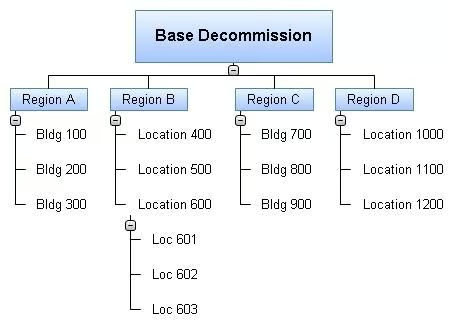
The first step is to develop a WBS that resembles the location hierarchy. I like to think visually before detailing the work in Microsoft Project, so I used Matchware MindView to develop a hierarchical WBS.
The base (the top level WBS deliverable) was divided into regions. Each region was comprised of specific buildings, and each building was further defined into specific floors. A general term “location” could also be used if resources were not assigned to a specific building but rather another ambiguous sub-region. The level of detail can be extended to individual offices or cube locations.
Screenshots by Andy Makar for TechRepublic
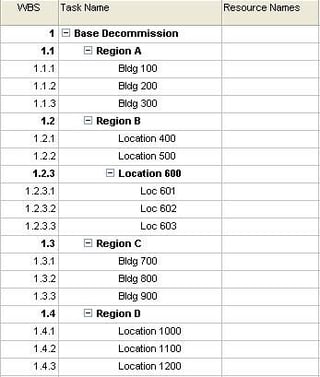
Once I had a visual breakdown of the base locations, I exported the model into Microsoft Project. I could have used MindView to assign resources and dates, but I chose to detail the WBS further in Microsoft Project due to the number of resources that would be added to each location or building.
Screenshots by Andy Makar for TechRepublic
Step 2: Set the project start date
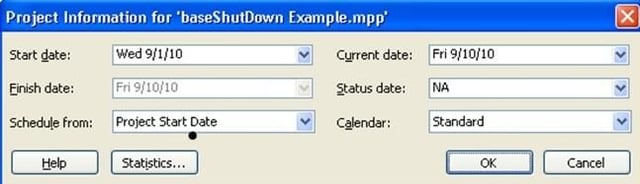
As each location is assigned a decommission date, you’ll want to have the correct project start date in Microsoft Project. To set the project start date, go to Project | Project Information and select the desired Start Date from the drop-down menu.
Screenshots by Andy Makar for TechRepublic
Step 3: Define the resource pool
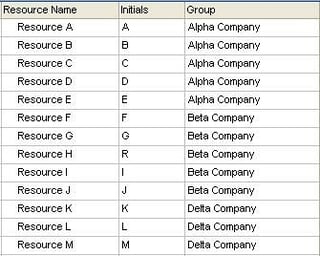
The next step is to define all the resources that currently occupy the base. Since this could extend to several hundred or thousand resources, you may want to import them from an Excel extract of a resource management system. Follow these steps to customize the resource sheet:
1. Go to View | Resource Sheet.
2. Right-click these columns and select Hide: Type, Material Label, Max Units, Standard Rate, Ovt. Rate, Accrue At, and Code.
3. Enter a name and a team name in the Resource Name and Group column.
Screenshots by Andy Makar for TechRepublic
Step 4: Assign resources to locations
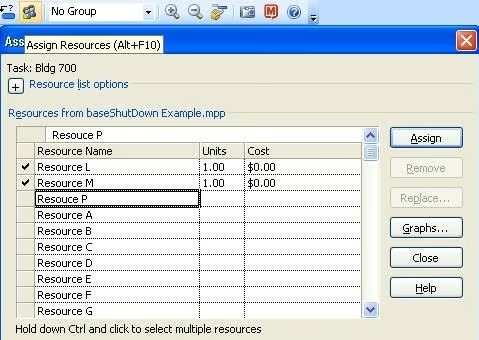
Now you should switch back the Gantt Chart view and assign resource names to the specific buildings in the WBS. Resources can be assigned by selecting the names from the Resource Name column or using the Assign Resource dialog box. Simply click the task and press [Alt][F10] to display the resource box.
Screenshots by Andy Makar for TechRepublic
Step 5: Assign location decommission dates
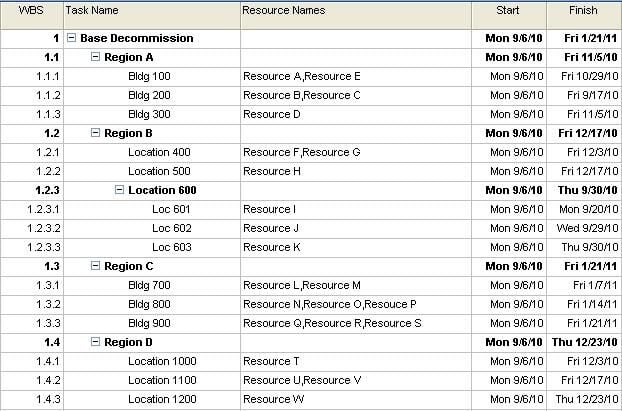
With your resources assigned, the next step is to either enter the duration it takes to evacuate the building or select a target Finish date. If this is a simple planning scenario where a specific building would be decommissioned, then a Finish date would be selected. If there are building dependencies for each building, then task predecessors may be used.
It is assumed that all the resources are assigned to the building at the start of the project, so all tasks should have the same Start date. By selecting the decommission date, the Finish date will be populated. This figure depicts the completed schedule with target dates.
Screenshots by Andy Makar for TechRepublic
Step 6: Set up the resource graph
The final step in setting up the model is to change the resource graph.
1. Go to View | Resource Sheet.
2. Go to Window | Split.
3. Click the lower window pane and select View | Resource Chart.
4. Right-click the Resource Graph and select the Peak Units graph.
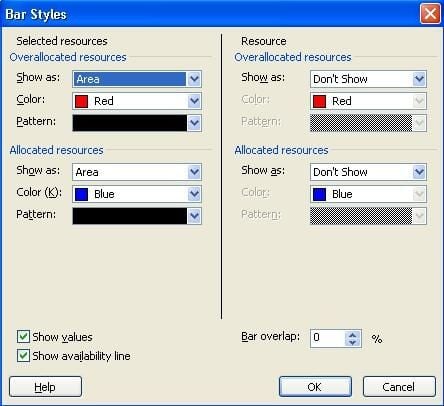
5. Right-click the Resource Graph and select Bar Styles.
6. Under the Selected Resources section (left-side), change the Overallocated and Allocated Resources Show As options to Area.
7. Under the Resource section (right-side), change the Overallocated and Allocated Resources Show As options to Don’t Show.
8. Confirm the options are the same as in this figure and click OK.
Screenshots by Andy Makar for TechRepublic
Step 7: View the resource graph
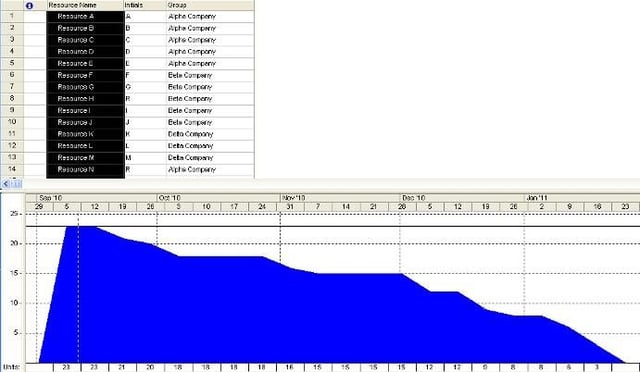
With the resources selected and assigned to specific buildings, you can view the resource ramp down curve overtime. By clicking the magnifying glass in the lower resource graph pane, you can view the resource allocation over time. By selecting multiple resources in the upper pane resource sheet, you can view the specific resource curve for each resource in the model.
The horizontal axis of the resource curve provides the resource count over time. Over the five month time span, the graph starts with 23 resources and gradually reduces to zero when the base closes. The horizontal line at the top of the graph represents the original resource level at the start of the project. By adding more resources and filtering on specific team names, project managers can view individual, team, and entire resource pool curves.
Download the .mpp file
If you want to download the baseShutdown.mpp file, you can access it on my site. In my next article, I’ll show how to interpret the resource management model and use several views to manage the resource decommission.
Screenshots by Andy Makar for TechRepublic

Dr. Andrew Makar, PhD, is an experienced IT program manager with several years in enterprise project management. He is the author of How To Use Microsoft Project and Project Management Interview Questions Made Easy and has contributed to publications like PMI, CIO Magazine, and TechTarget. A certified PMP and Agile practitioner, he has led multimillion-dollar projects across Fortune 500 companies.


