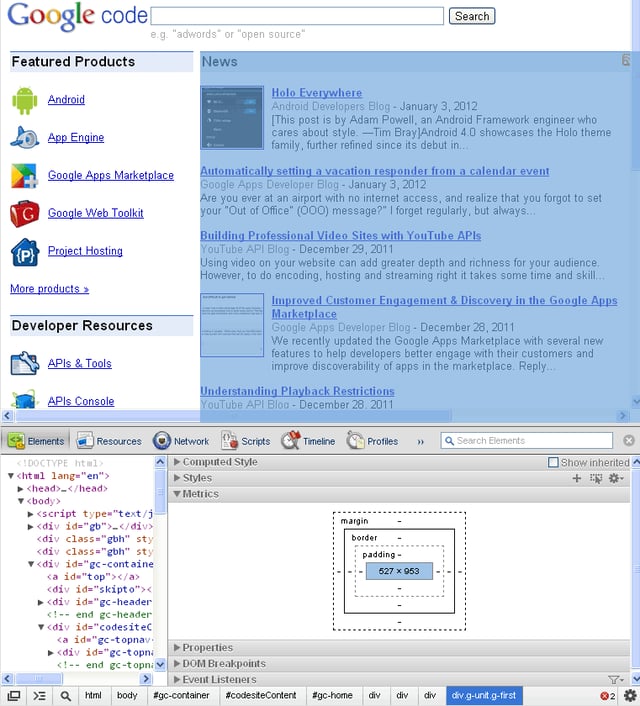
\n\tThe Elements panel of the Developer Tool lets you see everything in one DOM tree, and allows inspection of the DOM elements. I often visit the Elements tab when needing to identify the HTML snippet for a particular aspect of the page. The elements include the Computed Style, Styles, Matched CSS Rules, Metrics, Properties, DOM Breakpoints, and Event Listeners.
\n
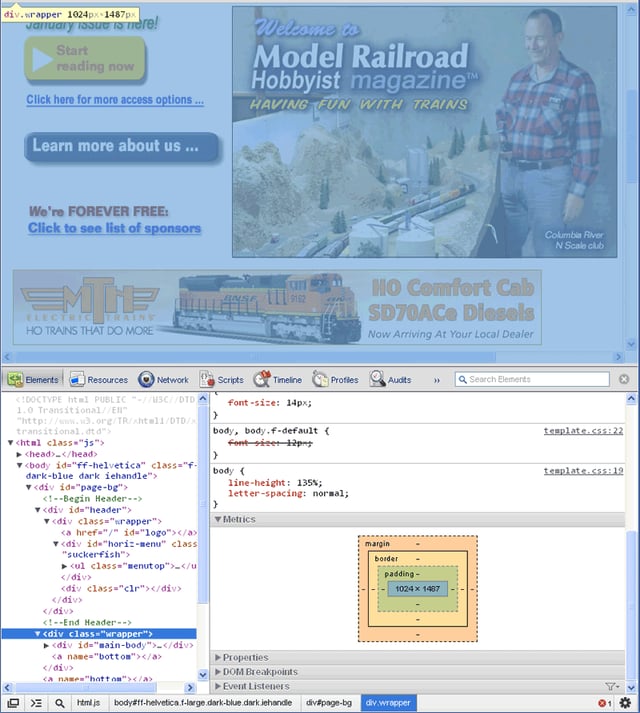
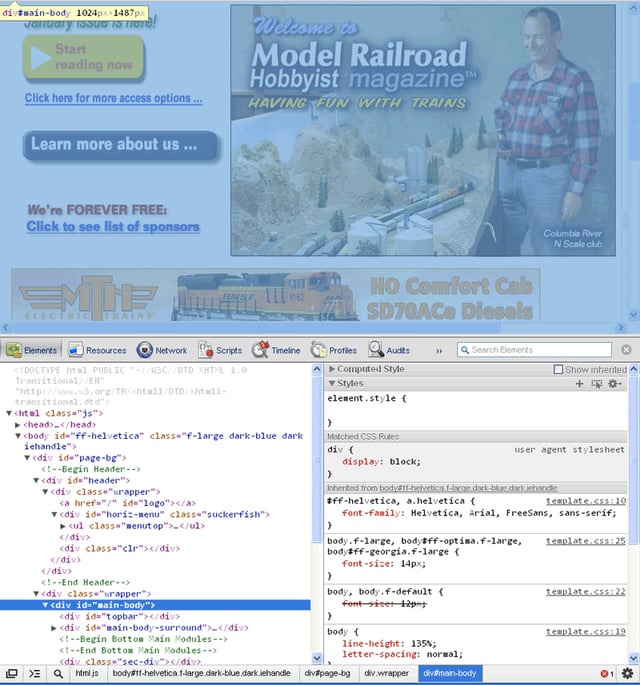
\n\tIn this demonstration I will start with using the Model Railroad Hobbyist page, with the page open in Google Chrome, right-click anywhere on the page and select Inspect Element at the bottom of the dialog box. By default, the console panel will open to the Elements Panel. With the Elements Panel active, we can view the HTML code, select an element, and view its properties. In this case the metrics for the main content block show how it is read by the browser, the area selected also becomes indicated by the blue overtone in the top browser panel. This shows the page’s HTML elements in the main pane, and styles, metrics, properties, and event listeners in the right-hand sidebar. This is very useful when you are curious about which part of the HTML generated a particular page element.
\n
\n\tNote: This compilation gallery is made up of these original blog posts, which you can also view individually in the Web Designer blog:
\n
\n\t
\n\t
\n\t
\n\t
\n\t
\n
\n\tThe DOM Elements Tree, including its inline scripts and styles, are syntax highlighted; for example, when I select the
\n\tSelecting any tag under the elements panel will take you to its associated styles, metrics, and properties, included but not limited to tags such as
,
\n\tAnother cool feature is that you can modify any of the code, style sheets, or scripts on the fly with in place script editing, giving you a review of the modifications on the client level running in Google Chrome. This gives you a nice way to see how other websites are built, and also gives you a great way to tweak your own sites. Therefore, this integrated environment allows for debugging, optimizing, and understanding a web application, or website. So, let’s take a look at some of the panel tools to peek under the hood of several websites.
\n
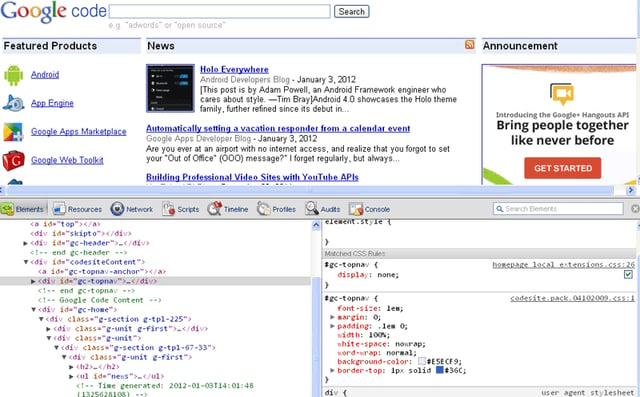
\n\tNow, let’s say you want to see what happens with the styling when you disable or modify a property. From the Matched CSS Rules you can disable any of the properties by deselecting the green check box, as shown here, where the margin has been disabled for the class=”g-unit g-first” results in the News and Announcements sections, dropping below the Featured Products section of the page.
\n\tRemember, you are only modifying the local file in your browser; you are not making updates to the actual web site; I just wanted to put that out there, as it seems there was some confusion by several folks about this function from several online boards and forums. The benefits of looking under the hood and making on-the-fly modifications allows you to study and learn how others are coding and styling the look and feel for their online content.
\n
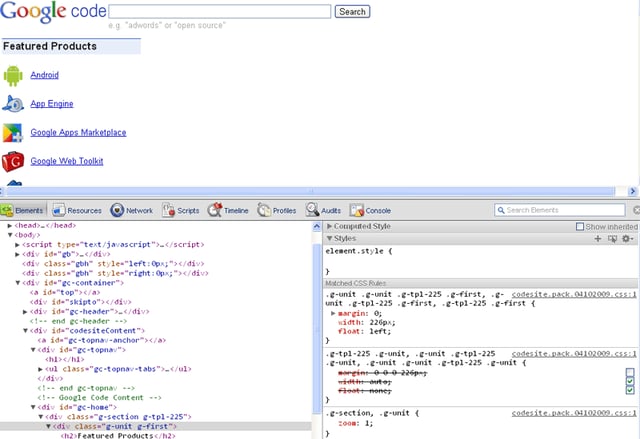
\n\tYou can also double-click any non-user-agent style property to edit or delete; for example, double-click the float: left; property. You should see something like this as displayed here.
\n\tTyping, or pasting in, one or more properties adds the new properties to the style rule. If you edit a style property value with a number, you can use the Up or Down arrow keys to change the number, and holding the Alt/Option key steps in increments of 0.1; holding the Shift key steps in increments of 10. You can also add more properties by double-clicking any white space to the left or below any existing entries or via pasting multiple properties separated by a semicolon. You can edit the style selector names via double-clicking their names, and you can also add new style selectors using the Gear Menu, located to the right of the Styles section bar as displayed here.
\n\tThis allows you to edit any of the absolute, relative, or fixed CSS box model metrics as displayed on the right side panel. Here is the example.
\n\tThe Event Listeners are shown for the selected nodes and are in the order in which they are executed and captured during the rendering, and are separated by type. If a node has both onclick and onmouseover listeners for instance, they will appear in different sections. Filter preferences can also be set from the Gear menu, and you can choose to see only the listeners registered on the selected node, or the entire event flow. Here’s an example of the click and document events.
\n\tYou can also search within the Elements Panel for any code, tags, ids, classes, and scripts on which you may want to focus your attention — even create a search list of high priority matches that you need to get to in a quick fashion. For example, typing \u201cform\u201d into the search box, results in 10 matches, and highlights the first instance.
\n
\n\tThe Elements panel also supports XPath and CSS selectors as queries in the search box, in addition to the plain text demonstrated above.
\n\tThe Resources Panel allows you to look under the hood to view Frame Resources, HTML5 Databases, and Cookies associated with the active browser page session.
\n
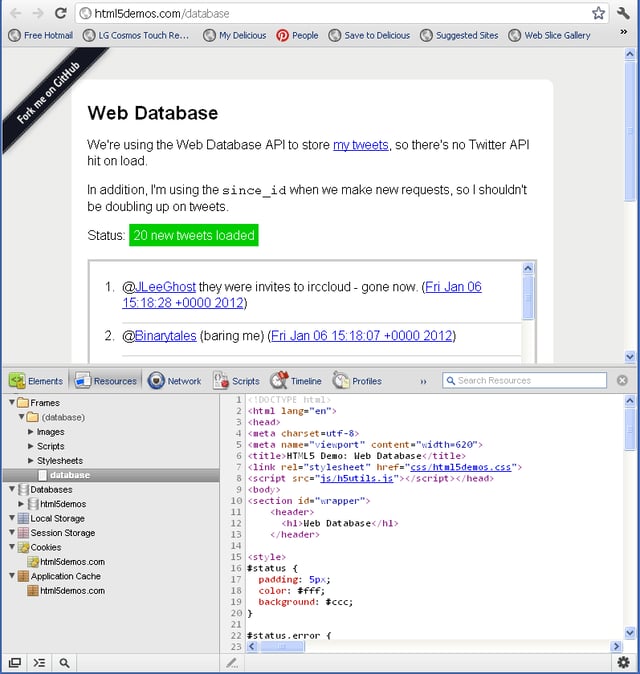
\n\tFor this demonstration I am going to open the HTML5 Demo: Web Database page and then right-click anywhere on the page and select Inspect Element. By default the console panel will open to the Elements Panel; click on the Resources tab to open the Resources Panel.
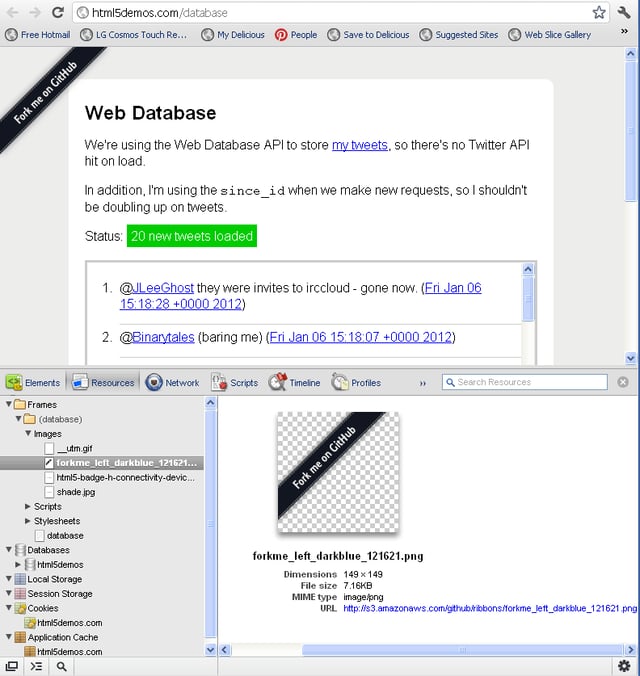
\n\tOnce inside the Resource Panel, we can view the HTML, which by default, opens to the web page file contained within the Frames resources. In this case, we see database and then the database page file. Also under Frames are all the other resources such as folders for Images, Scripts, and Stylesheets. Clicking on the Images drilldown displays a listing of all images associated with the page, and clicking on the \u201cforkme_left…\u201d image results in the right panel display including the full name of the image file, the dimensions, the file size, the MIME type, and the full URL for the image file.
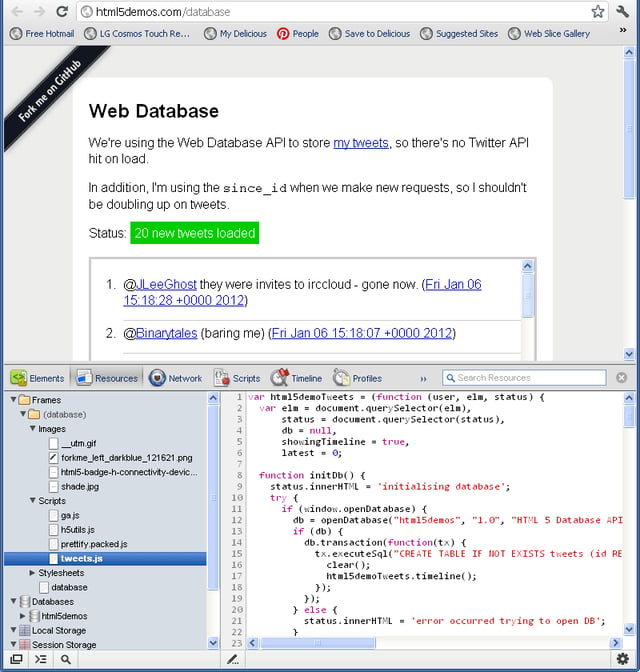
\n\tContinuing on the left-side panel we find the Scripts drilldown display and can view four .js files; when the \u201ctweets.js\u201d file is highlighted we can view the contents of the file within the right-side pane.
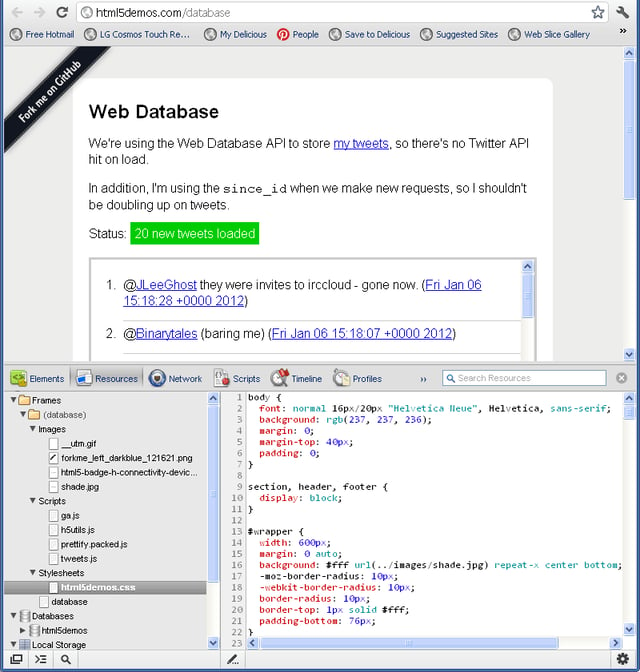
\n\tNext we see the Stylesheets, and one file is found — the \u201chtml5demos.css\u201d.
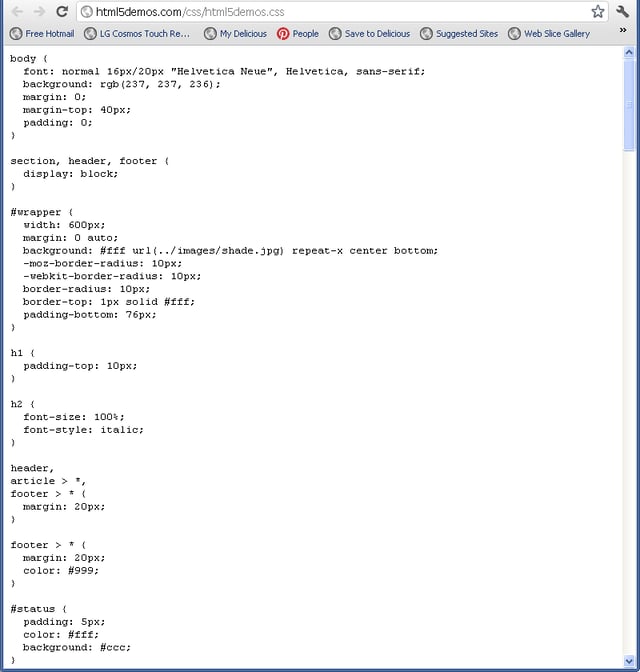
\n\tIf you double-click the file name, Chrome will open a separate window and display the file in text view or source mode.
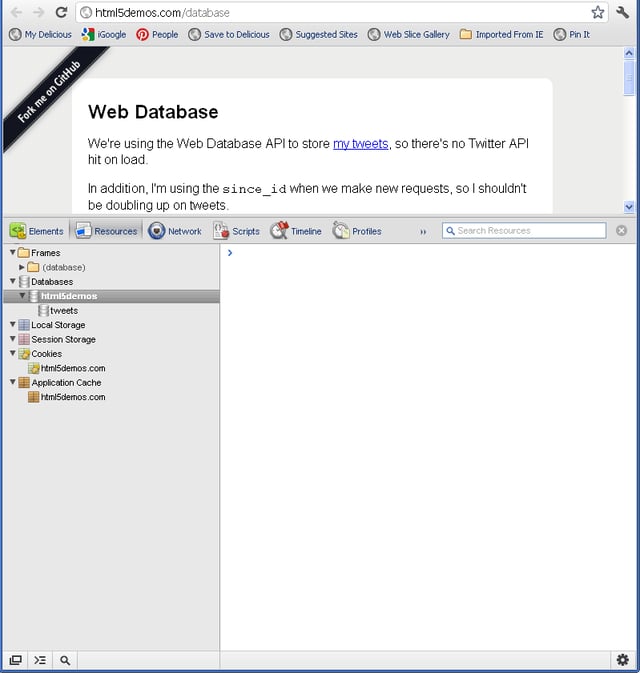
\n\tNext, under the Resources Panel, we can view the HTML5 Databases, and in this case we can see that the html5demos page has a data source to the \u201ctweets\u201d database .
\n\tAt the chevron prompt, you can type in select * from tweets. The input in the database console has auto-completion and tab-completion for common SQL words and phrases along with table names for the database. Notice as you type in the phrase that it will auto-complete before you finish.
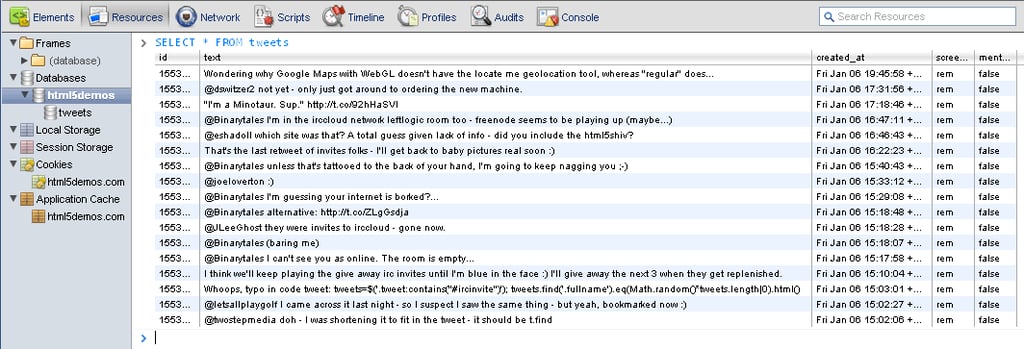
\n\tUpon hitting enter (return) the resulting query displays the database in table format with the column id, text, created_at, screen_name, and mention entries using the Web Database API to store the tweets.
\n\tThe final resources we will look at are the cookies associated with the domain and web page. By clicking on the Cookies, and then the \u201chtml5demos.com\u201d we can view all the associated cookies, their name, value, domain, when they expire, and the size of the cookie. You can also delete them from this listing by highlighting first, and then with a right-click, select Delete. The cookies for this page demonstration are displayed here.
\n\tNow, I’ll demonstrate using the Console Panel to conduct debugging, inspect the DOM, or analyze any HTML errors for selected web pages. In previous posts on the Google Development toolkit, I introduced the Elements Panel and the Resource Panel.
\n
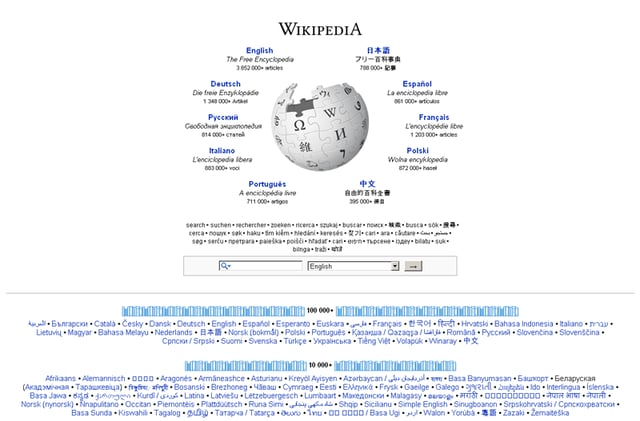
\n\tIn Google Chrome, select any page you wish to inspect; for this example, I will be demonstrating the Console using the Wikipedia.org website.
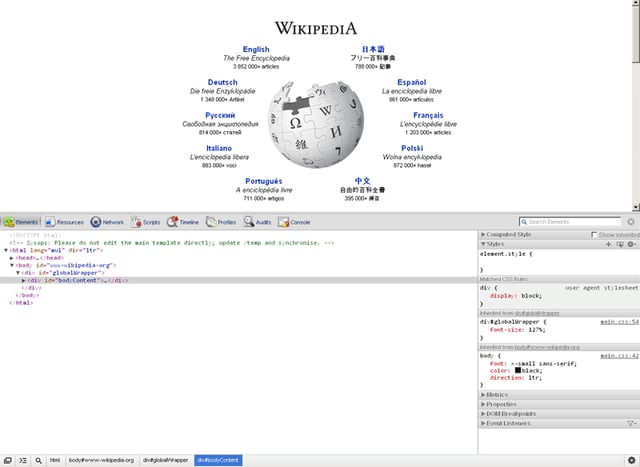
\n\tThere are several ways to open up the Google Web Developer Tools; the easiest way is to just right-click on any page element and select Inspect element, resulting in this display for the Wikipedia.org site; this is the docked view. If you wish to undock the tool, click the dock/undock icon at the bottom left of the tool
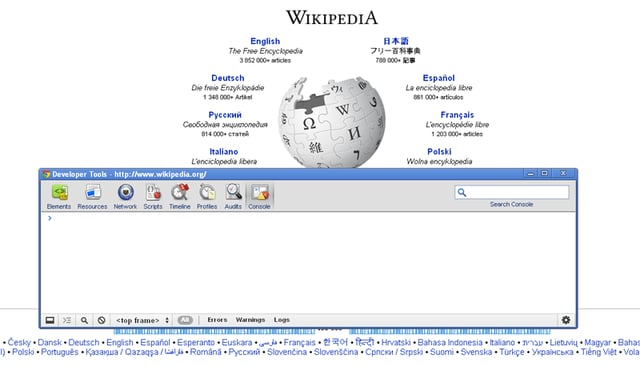
\n\tNext, click the show Console button on the far right side of the toolbar. If there are any errors or warnings detected, they will be displayed in the bottom-right corner of the window. Clicking on any of these errors will also open the Console panel.
\n
\n\tThe Console provides auto-completion and tab-completion; therefore, as you type expressions, property names are automatically suggested. If there are multiple properties with the same prefix, pressing the Tab key will allow you to cycle through the list. Pressing the right arrow key will accept the highlighted suggestion. The current suggestion is also accepted by pressing the Tab key if there is only one matched property. The Console panel supports all 21 functions provided in Firebug’s Command Line API. Here is Console panel un-docked.
\n\tCommand Line API is particularly useful when working with the Elements panel in conjunction with the Console panel. While in the Elements panel, open console by pressing the Esc key.
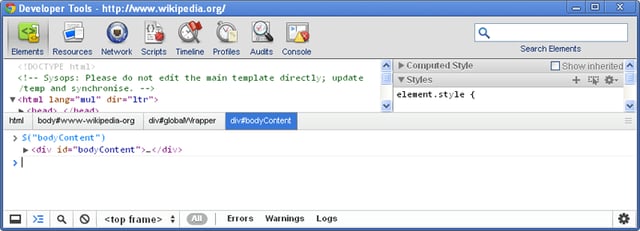
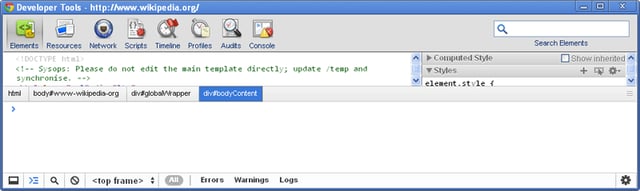
\n\tThe following examples will demonstrate returning a single element with a given id using the command line function $(id). At the Console prompt, type $(\u201cbodyContent\u201d) and press enter. The command dumps the node with the given id — in this case, bodyContent — and displays it in the Console panel.
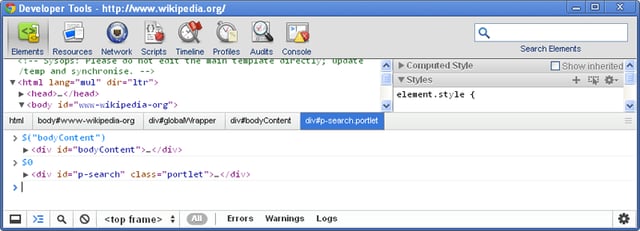
\n\tUsing the command line function $0 returns an array of elements that match the given XPath expression. For example typing $0 at the Console prompt will dump the most recently selected node into the console.
\n\tThe command line function $1 returns the currently-selected object in the Console panel, and $n will display previously selected nodes.
\n
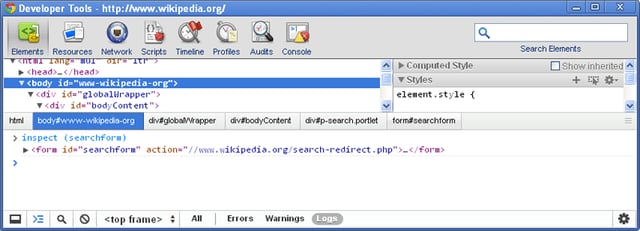
\n\tInspecting an object in the most suitable tab, or the tab identified by the optional argument tabName using the function inspect (object[, tabName]), the available tab names are “html”, “css”, “script”, and “dom”, for example at the console prompt type in inspect (searchform) and press enter; the selected object with the given id is displayed .
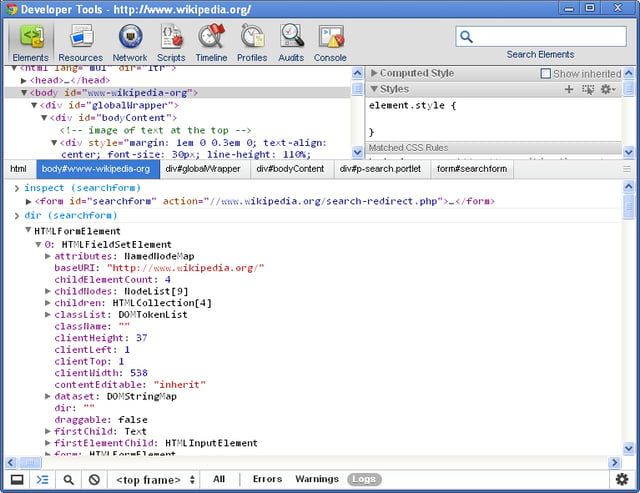
\n\tThe dir (object) function prints an interactive listing of all properties of the specified object, and will appear identical to the view that you would see in selecting a DOM tab. In this example, at the console prompt type in dir (searchform) and press enter, the resulting display dumps the object with the given id, and as a JavaScript object with its associated properties.
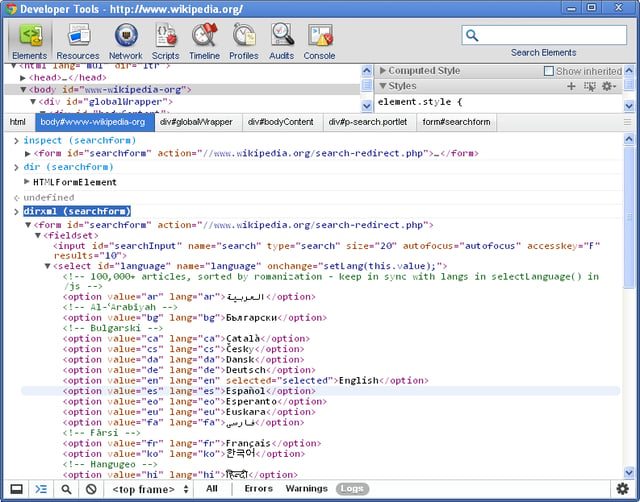
\n\tThe dirxml (node) function displays the XML source tree of an HTML or XML element. In this example, type dirxml (searchform) into the Console prompt and click return; the resulting dump displays the object of the given id as an HTML sub-tree.
\n\tThe Network Panel is part of the Google Chrome Developers tools, and it allows you to inspect resources as they are accessed over the network. The example demonstrated in this segment will inspect the U.S. edition of CNN.com.
\n
\n\tIn Google Chrome, go to http://www.cnn.com, then right-click anywhere on the browser and select Inspect Element; once the tool panel opens up, click to select Network, then press F5 on your keyboard to refresh the page. You will notice that the timeline will begin populating file names in a waterfall list of associated network activities.
\n\tLatency, or the time between making the initial request and the server’s first response is displayed on the timeline as the lighter shaded bar for each named file. Moving your cursor over a \u201cbar\u201d in the timeline will display a detailed balloon, as in the example. The file http://www.cnn.com displays the DNS Lookup at 42ms, Connecting at 67ms, Sending at 0, Waiting at 113ms, and Receiving at 232ms.
\n\tThe blue vertical line displayed in the waterfall timeline on the right panel represents the firing of the DOMContentLoaded event, and the red vertical line represents the Load event. These two indicators are provided to help you determine the total time it takes for pages to load and gives you a benchmark from which to make improvements to your pages. The two events are displayed here, and the screen capture is further down the named resources list.
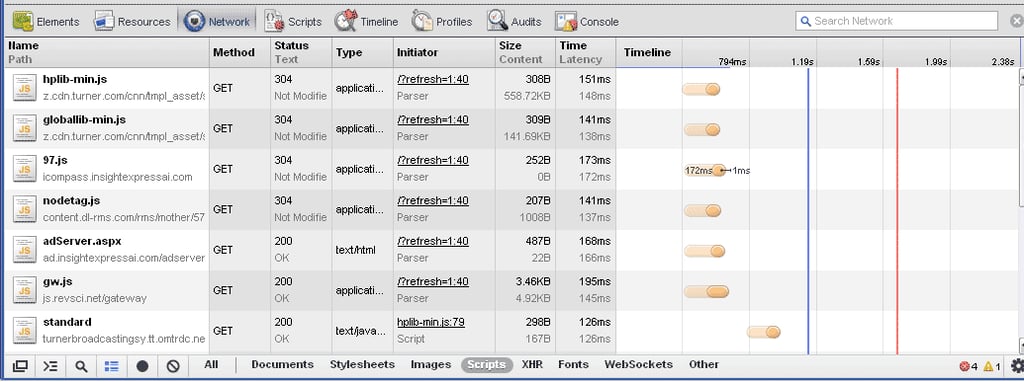
\n\tOn the bottom of the Network Panel are options to view the web page resources, including All, Documents, Stylesheets, Images, Scripts, XHR, Fonts, WebSocket, and Other. I’ve selected the Scripts resource in the example.
\n\tBy default the display is sorted by Timeline; however, you can modify the sorting from a drop-down list which in addition to the Timeline also includes Start Time, Response Time, End Time, Duration, and Latency.
\n\tSelecting the sort by Latency, I get this view.
\n\tAnother sort that you can run in either ascending or descending order is by the Size column, in descending order from the largest resources to the smallest.
\n\tNow, click on the http://www.cnn.com resource entry from the left-side pane, and the display on the right-side pane will default to the Preview tab mode, which shows the HTML under the hood. Other options include Headers, Response, Cookies, and Timing. This is the Headers tab.
\n\tThe Cookies tab
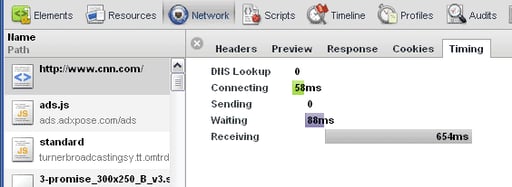
\n\tThe Timing tab
\n\tThe Network Panel Preview tab is similar in functionality and view to the Resources Panel’s Resource view, here.
\n\tThe Google Chrome Scripts Panel allows you to debug JavaScript code that is attached to active websites. In this demonstration, I will be using The Salvation Army website, to view and manipulate the associated JavaScript files. All told, the website includes thirteen *.js files and I will only demonstrate functionality with a few of the associated script files.
\n\t#1 With the Salvation Army website open in Google Chrome, right-click anywhere on the page and select Inspect Element.
\n
\n\t#2 Select the Scripts tab to make that the active panel; by default, the \u201capplication.js\u201d file opens as displayed.
\n\tThere are several items to note on navigating through the Scripts Panel, and they are listed and highlighted here.
\n
\n\t
\n\t
\n\t
\n\t\t\t
\n\t\t\t
\n\t\t
\n\t
\n
\n\tHere is a partial drop-down list for this example. Notice that several scripts are organized under the /javascripts directory; several are located under another directory named /WebManager/themes/20/javascript, and so on.
\n\tYou can set one or many breakpoints in one or many scripts by selecting the line gutter to set a breakpoint for a particular line of code; then, you can select another script and set another breakpoint and so on as shown. Notice on the right panel the breakpoints that you set now appear with checked boxes.
\n\tClicking on any one of the entries will jump the left side panel to that line of code and will temporarily highlight that line.

\n\tOnce you have a breakpoint set, you can right-click on the blue tag breakpoint indicator in the gutter line to set a conditional statement for that particular breakpoint. Type any expression and the breakpoint will pause only if the condition is true. Delete a breakpoint by clicking the blue tag breakpoint indicator. The breakpoint indicator has several states: Continue To Here, Remove Breakpoint, Edit Breakpoint, Disable Breakpoint, and Save As… which will save the *.js file.
\n\tWith the \u201cjquery.js\u201d file selected, pause the script and then you can view the current call stack and the associated in-scope variables in the right-hand side bar.
\n
\n\tThe list of keyboard shortcuts available in the Scripts panel includes:
\n
\n\t
\n\t
\n\t
\n\t
\n\t
\n
\n\tSimilar to the Network Panel, the Google Chrome Developer Tools Timeline Panel provides an overview of the time that is spent loading a web page document or application.
\n
\n\tIn this demonstration, I will be using The Weather Channel (TWC) to illustrate the online tool. Of course you can use any website you wish, to do your own experimenting.
\n
\n\tDevelopers at Google have been working on improving scalability and traceability while providing more details on recorded events that display in the Timeline Panel.
\n
\n\tIn Google Chrome, type in the URL http://www.weather.com/ into the address bar or search for \u201cThe Weather Channel\u201d. Once open to the page, right-click and then select Inspect Element.
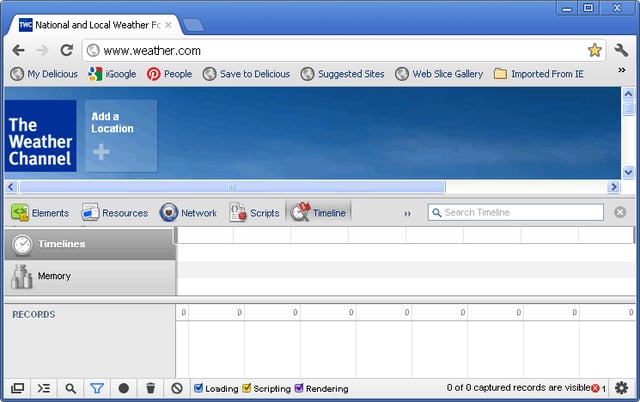
\n\tIf the timeline panel is not already selected, make sure you click on Timeline.
\n\tNext, you will want to start to record a session by clicking on the Record button, then refresh the page (F5); once clicked, you will see the record button turn from gray to red while recording, and the timeline will begin to capture the Loading, Scripting, and Rendering timelines for the web page.
\n\tAfter several seconds of capturing, you can click the record button again to stop the timeline recording session, the circle will change back to gray. I let the record session in this demonstration run for about 12 seconds.
\n
\n\tThe top level view shows the events which have been recorded and are grouped into three categories. The timeline for Loading is represented with a blue line, Scripting is a yellow line, and Rendering is a purple line. The Loading category records all network-related events. The Scripting category includes JavaScript execution upon various events, and Rendering calculates CSS rendering and paint-related activities as they are loaded. The top area also includes a resizable sliding window.
\n
\n\tThe center area lists a set of records, and these records have titles to the left and timeline bars to the right. Hover over a record or clicking over an event provides details on the events, as shown with the Send Request record.
\n\tExpandable compartments on the graph visualize nested records, as shown with the Layout record.
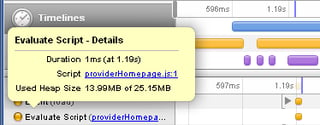
\n\tAnother way to further investigate a scripting event is to click on any yellow Record from the right panel. In this case, I selected an Evaluate Script, and then clicked on the resource link, which took me to the Scripts panel where I could view the script file which the event called..
\n\tHere is the script file called.
\n\tClick on any blue record to view a network event; in this case, I selected a Send Request as shown. .
\n\tHere, I clicked on the resource link and it displayed this image in the right side panel.
\n
\n\tThe Timeline Panel gives you a look under the hood of how the browser renders web pages and lets you see which processes and resources require more computing power for both rendering and JavaScript load times. This tool allows you to visualize where you need to fine tune and better optimize your web applications.

Thirteen years of web and graphic developer experience.


