NASA’s Lunar CRater Observation and Sensing Satellite (LCROSS) satellite, which was sent to the moon last summer and crashed into it in early October, has revealed some interesting data — water!
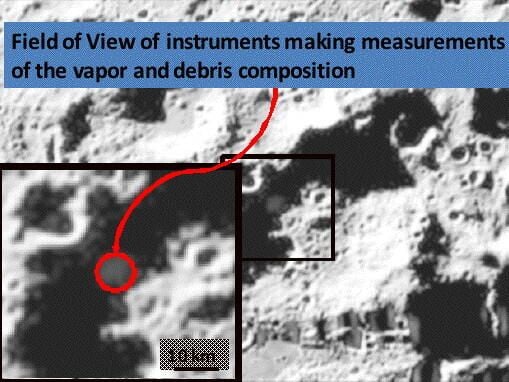
This image shows the spectrometer’s field of view (the red circle) focusing on the plume of dust about 20 seconds after impact. (A spectrometer examines what light or near-visible radiation — infrared and ultraviolet — is absorbed or emitted to determine the composition of a material.)
Image credit: NASA
For more about this topic, read my latest Geekend post about LCROSS.
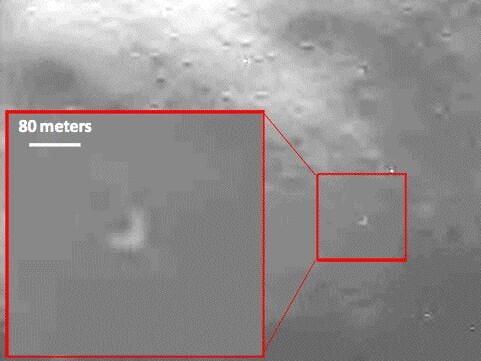
A close-up view of the crater caused by the centaur impact as seen by the infrared camera.
Image credit: NASA
For more about this topic, read my latest Geekend post about LCROSS.
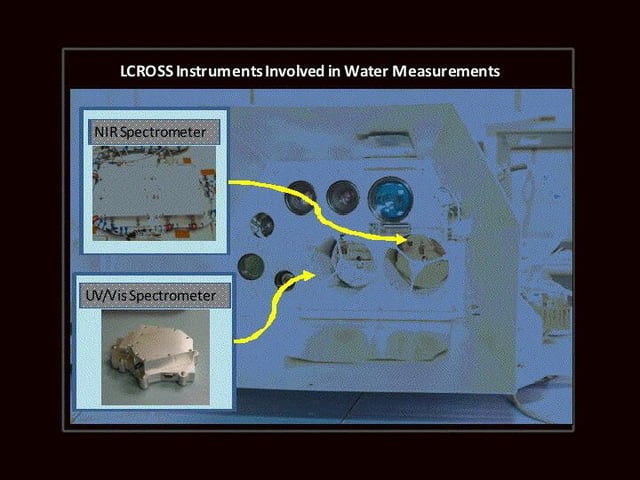
Here is the instrument array of the LCROSS satellite.
Image credit: NASA
For more about this topic, read my latest Geekend post about LCROSS.
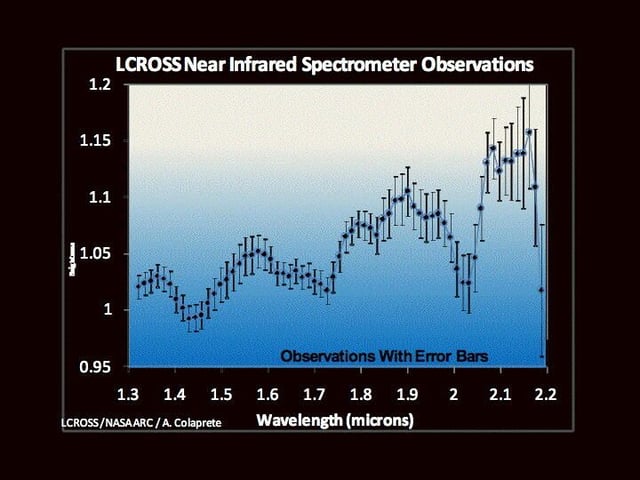
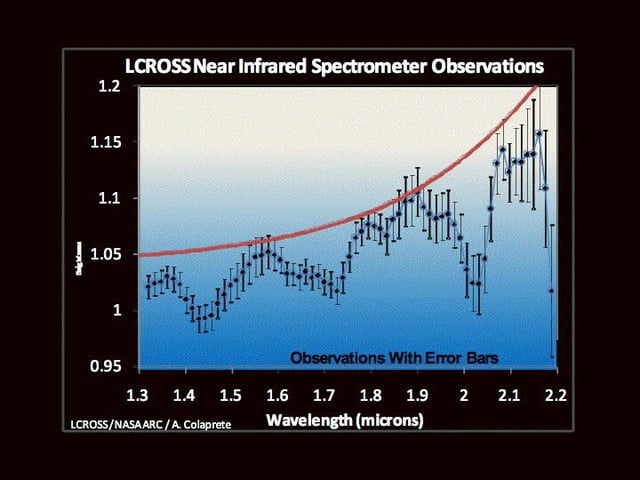
This graph shows the infrared measurements of the dust cloud. Error bars are included.
Image credit: NASA
For more about this topic, read my latest Geekend post about LCROSS.
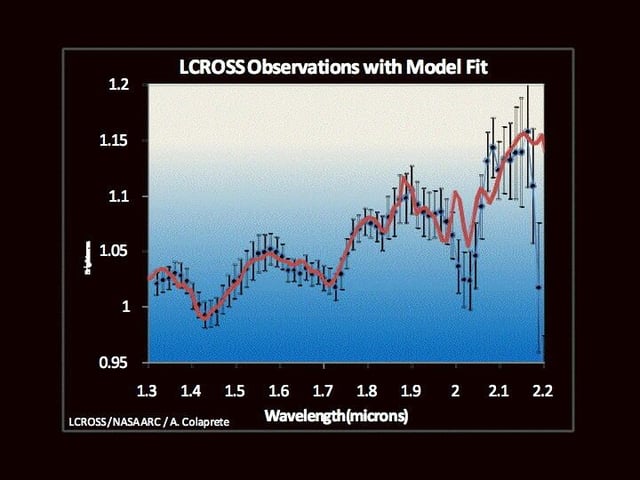
The red line shows what the measurements would be if there was nothing but dust. Obviously, there’s more present.
Image credit: NASA
For more about this topic, read my latest Geekend post about LCROSS.
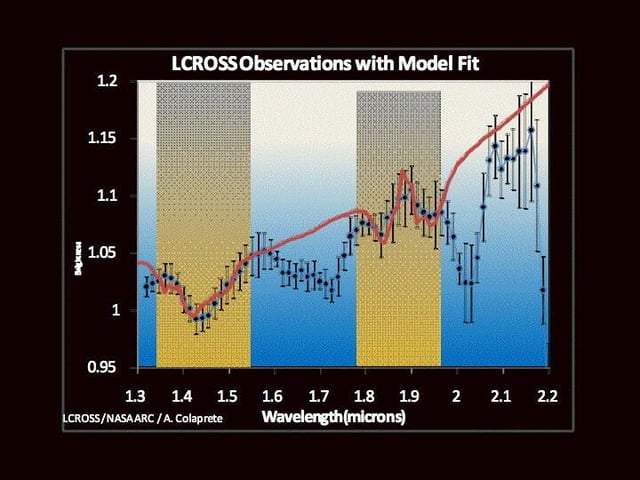
The red line in this image has been altered within the yellow bands to show what the readings would be if water were present in the plume. This is the evidence NASA was looking for: There is water on the moon!
Image credit: NASA
For more about this topic, read my latest Geekend post about LCROSS.
This graph shows a red bar with effects of many compounds. As you can see, NASA is very close to determining everything that was present in the plume.
Image credit: NASA
For more about this topic, read my latest Geekend post about LCROSS.
NASA scientists can use this information in much the same way as the infrared information in the previous image to determine compounds present in the plume.
Image credit: NASA
For more about this topic, read my latest Geekend post about LCROSS.
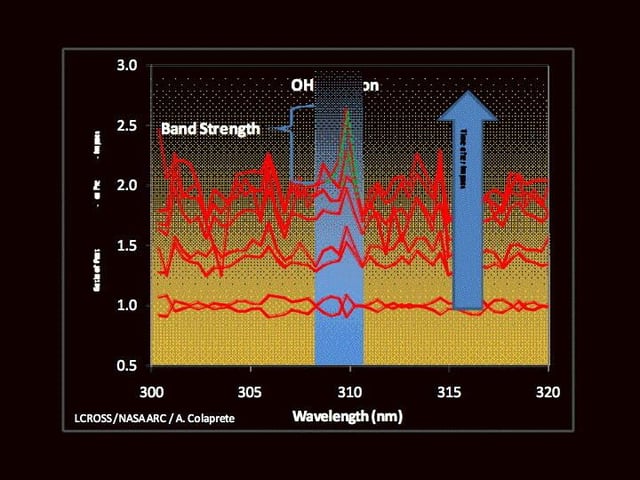
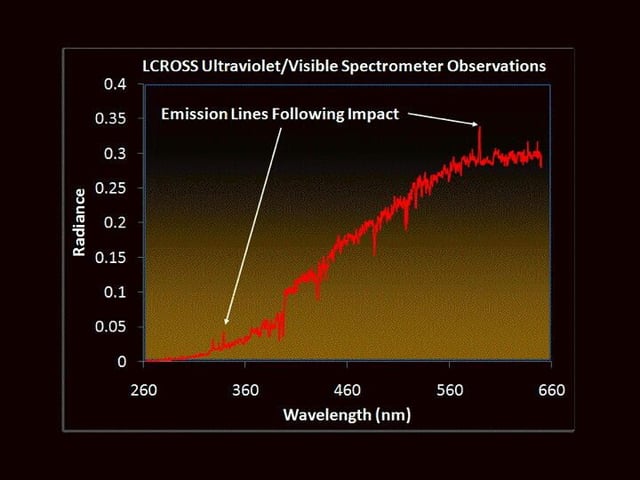
The spikes in this graph are indicative of water being present in the plume as this data describes the amount of OH (Hydroxyl) in the line of sight of the spectrometer.
Image credit: NASA
For more about this topic, read my latest Geekend post about LCROSS.
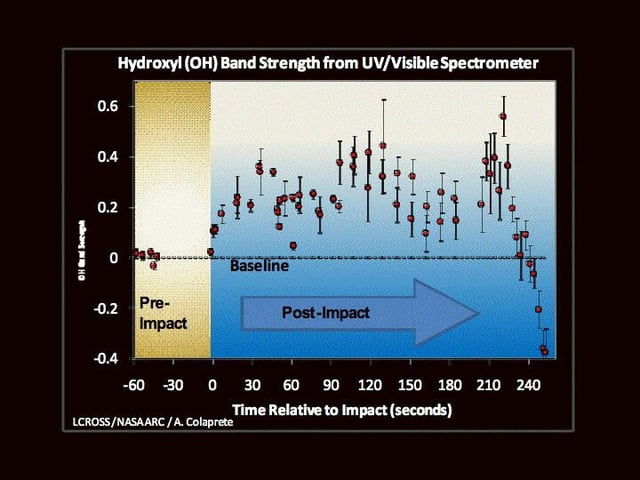
Plotted against time, this shows the amount of OH the spectrometers detect in their field of vision as related to the impact point.
Image credit: NASA
For more about this topic, read my latest Geekend post about LCROSS.


