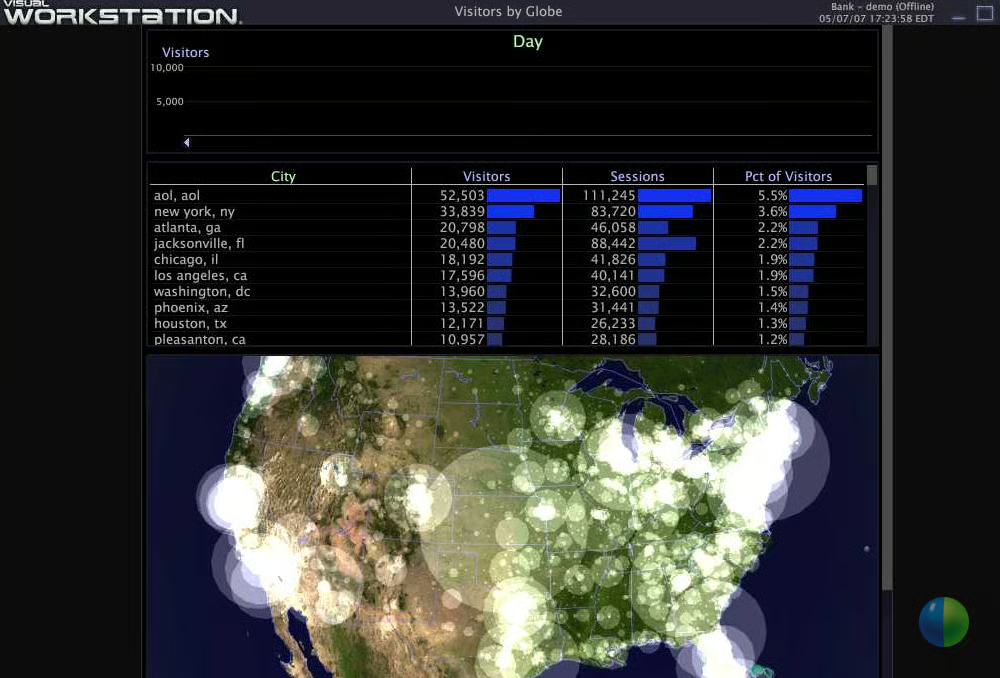
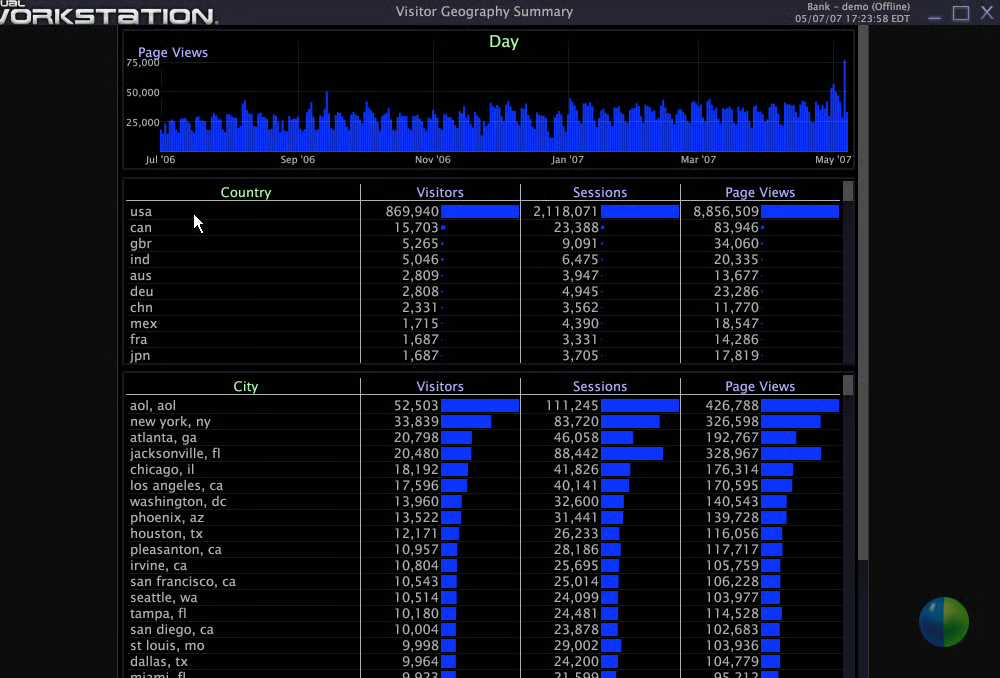
Visual Sciences, the company formerly known as WebSideStory, is taking its Web analytics software and extending it into the enterprise. The general idea is to take the analytics capabilities Web marketing folks use daily and extend it to other parts of the business. For instance, Visual Sciences software can analyze any data in an enterprise such as interactive voice response (IVR) information, customer information and point-of-sale transactions. Here are some screens from a demo of the company’s Visual Workstation application. The demo is focused on Web site information but can apply to any information that resides in a data warehouse. This particular slide shows the geographic breakdown of a Web site’s users. The white clouds on the map indicate the density of users in an area. This blog post has more on Visual Sciences’ strategy. Click to zoom on any image.
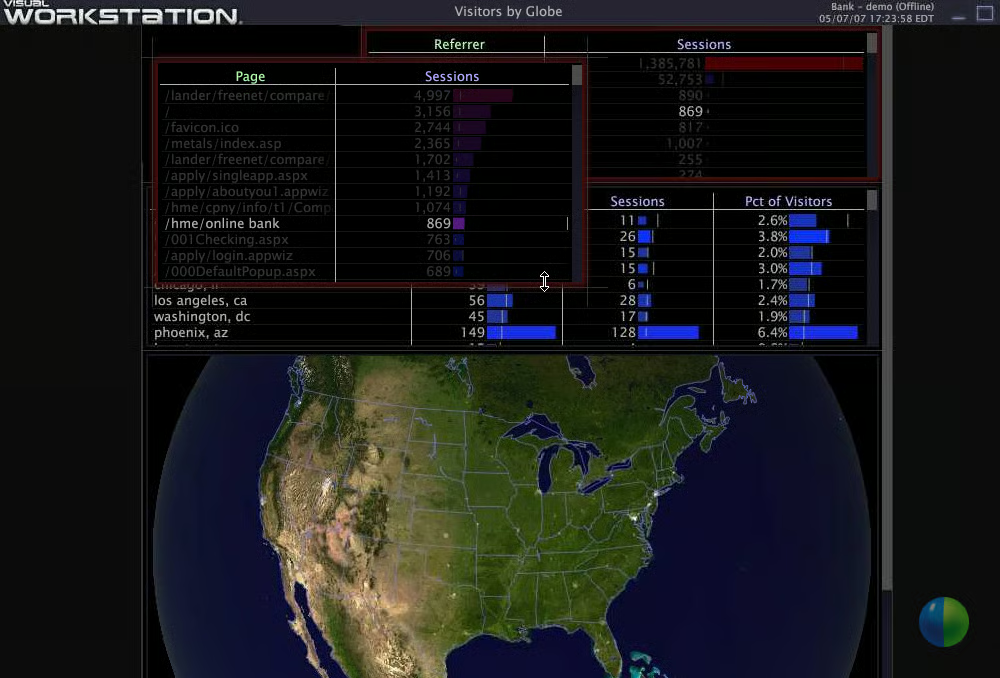
Any screen can offer a drilldown via a right mouse click. Here the Visual Workstation hones in on a specific region.
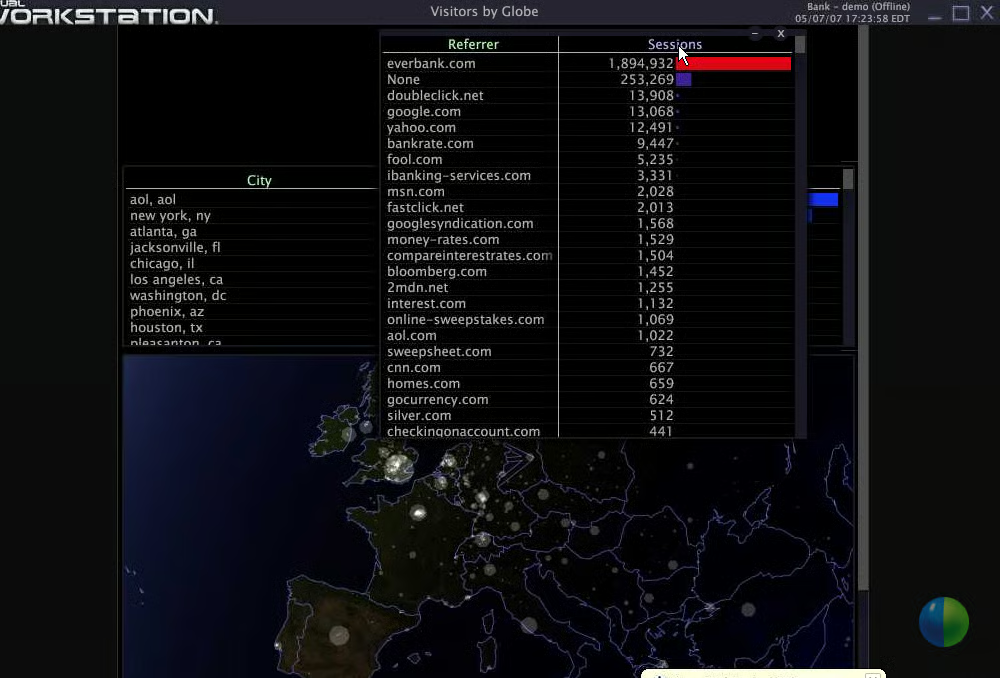
A look at referrers and other drilldowns on the software.
Visual Workstation offers various layouts that can be customized. This view matches city with referring sites.
Visual Sciences looks to take data and create 3D representations for executives and analysts to peruse.
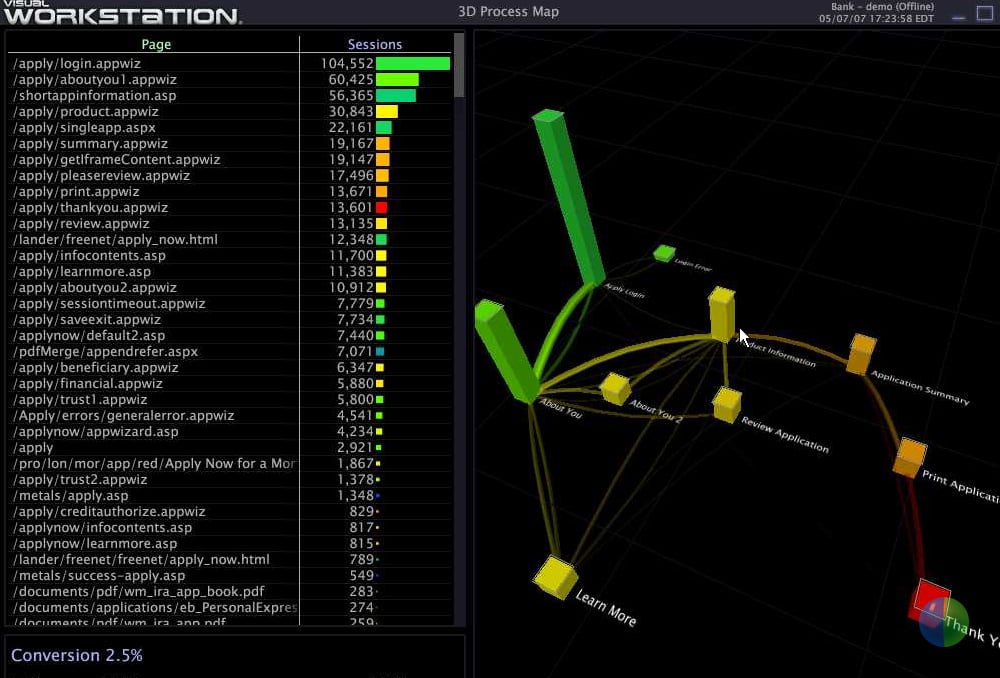
An example of a 3D process map.
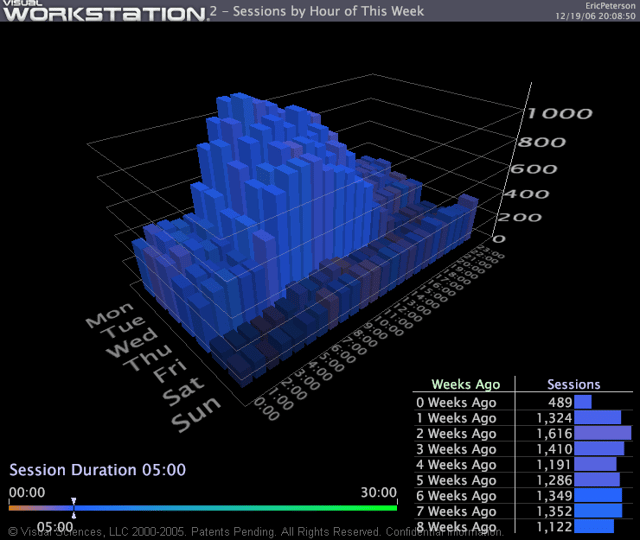
This 3D process map combines time and page views. It could just as easily map customer service calls into a call center.
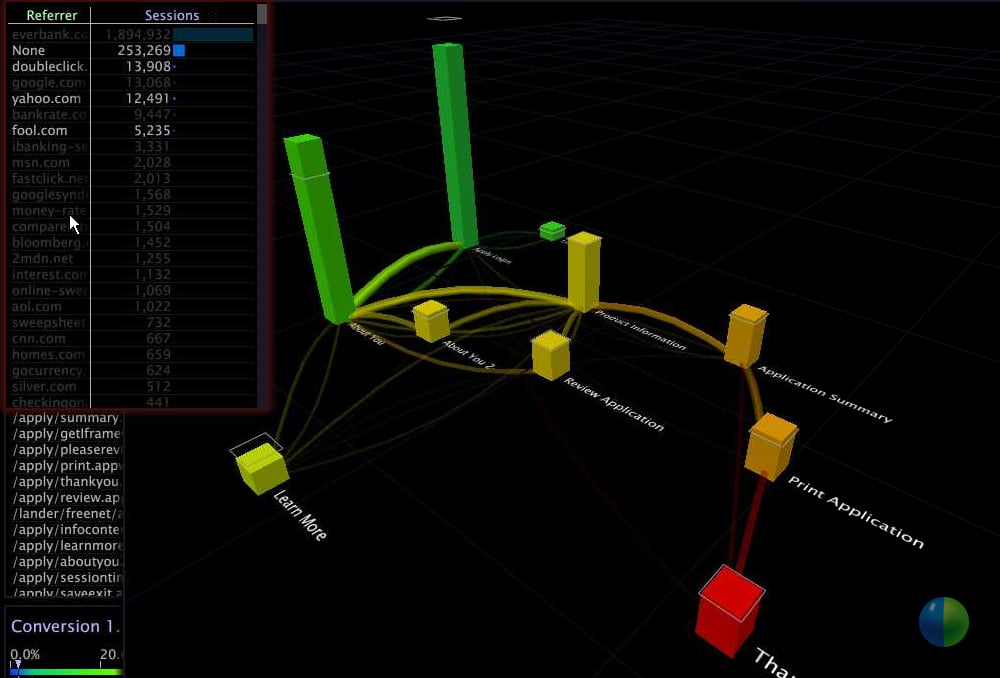
A drilldown on a specific referring site and where they went. This example shows how referrals from DoubleClick result in different traffic patterns than visitors sent by Yahoo.
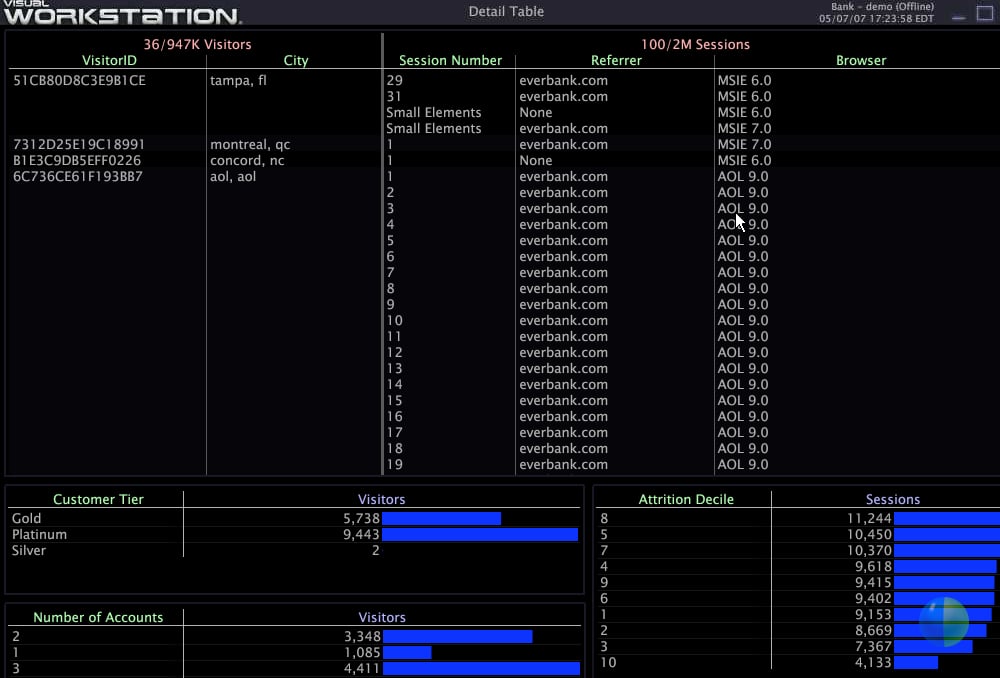
Individual visitors can be tracked based on unique characteristics. On the enterprise level a manager could drill down to an individual customer transaction.
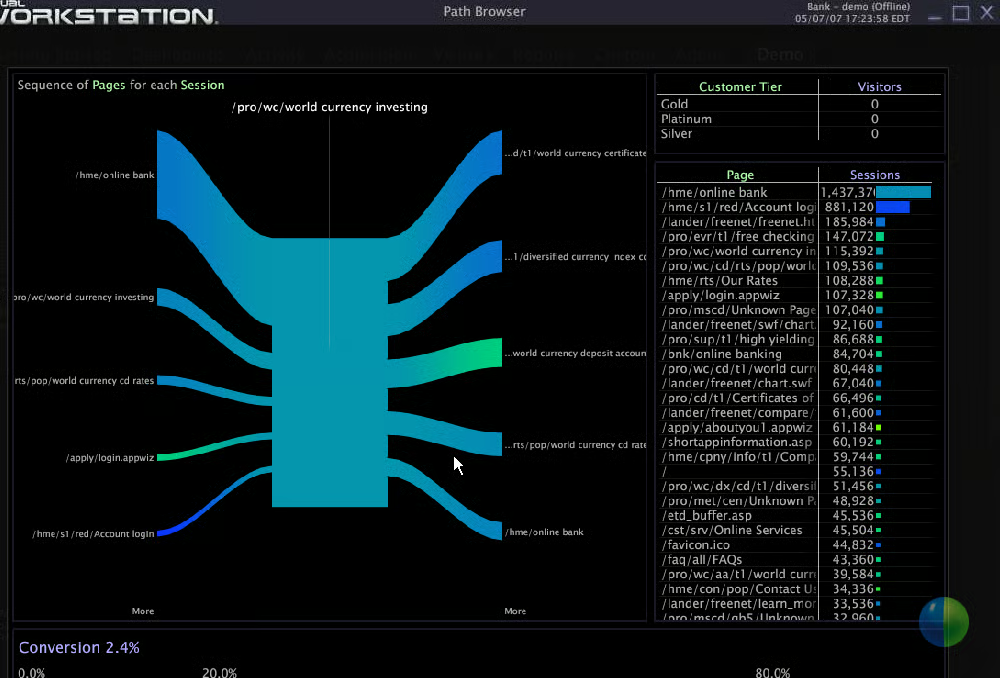
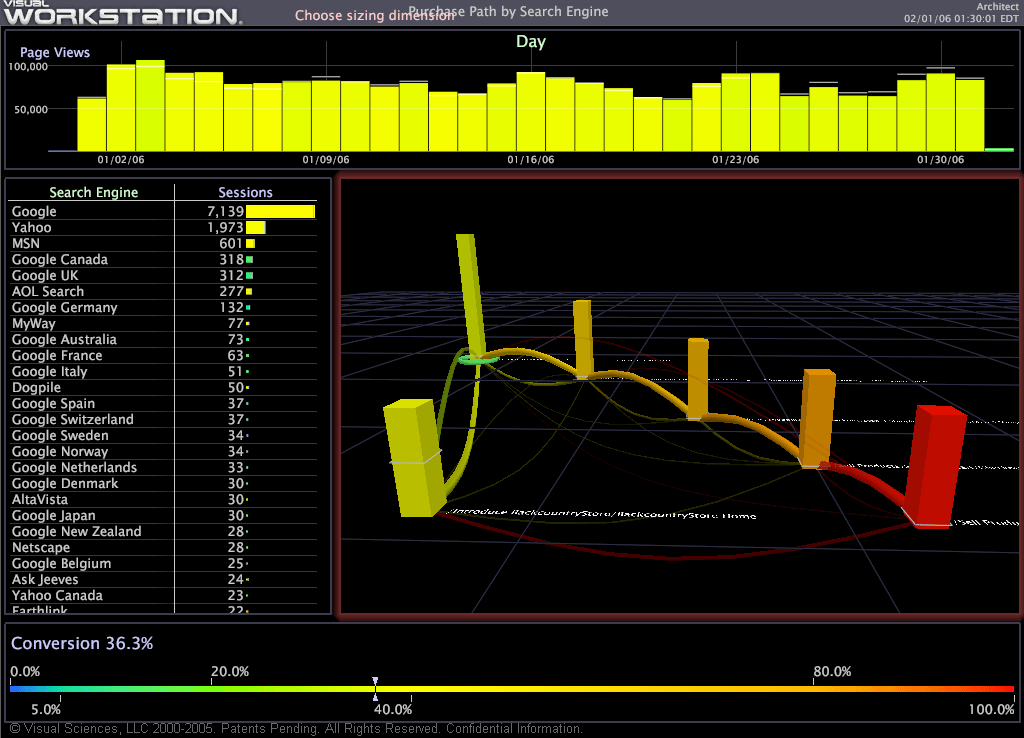
An example of a path analysis. In the demo Visual Sciences drilled down to multiple levels. In theory, a user’s ability to drill down into data is only limited by the size of the screen.
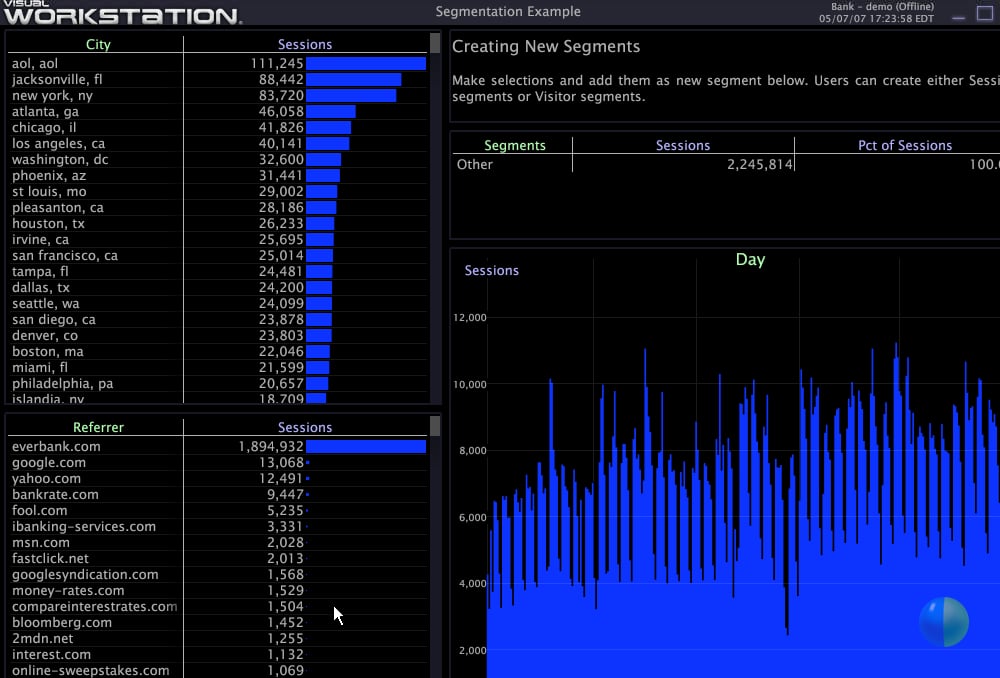
An example of a summary screen laying out data without the 3D rendering.

Larry Dignan is Editor in Chief at Celonis. He was most recently Vice President, Editorial and Editor in Chief at ZDNet. Prior to that he was executive news editor at eWeek and news editor at Baseline. He also served as the East Coast news editor and finance editor at CNET News.com. Larry has covered the technology industry since 1995, publishing articles in WallStreetWeek.com, Inter@ctive Week, and The New York Times. He's a graduate of the Columbia School of Journalism and the University of Delaware.


