


As I described in the article How to revive a Windows 7 system with a clean install via the Windows 10 Media Creation Tool, I installed a 64-bit version of Windows 10 on my old ASUS F3 laptop with an AMD Turion 64 X2, 80GB hard disk, and 1GB of RAM. Now, I know that Microsoft recommends 2 GB of RAM for 64-bit Windows 10, but I thought I’d give it a shot to see how this old system would hold up. I must say that it’s actually been performing quite well. Of course, I have noticed that the lack of memory has a detrimental effect on performance. But I only use this system occasionally and then mostly for surfing the web and playing a few online games. So it is acceptable.
Must-read Windows coverage
- CrowdStrike Outage Disrupts Microsoft Systems Worldwide
- 10 Best Project Management Software for Windows in 2024
- Windows 10 Extended Security Updates Promised for Small Businesses and Home Users
- Securing Windows Policy
The thing is that using this old laptop with its limited memory has sparked my interest in investigating memory usage on the Memory tab of Resource Monitor. And I’ve rediscovered how powerful this tool can be. So much so, that I’ve also been using Resource Monitor to track the memory usage on several of my Windows 10 systems. As I’ve been doing so, I’ve discovered some valuable information that I’m sure you could put to use on your Windows 10 systems. Let’s take a closer look.
SEE: 10 quick tips to make Windows 10 work the way you want
Memory overview
Let’s quickly review memory management in Windows 10. That will make the information displayed on the Memory tab easier to sort out.
Basically, Windows 10’s memory manager creates a virtual memory system consisting of available physical memory and a page file system on the hard disk. Using this virtual memory system enables the OS to allocate fixed-length blocks of memory (pages) that are contiguous in both physical memory addressing and virtual memory addressing.
Getting started
To get started with Resource Monitor, press Windows +R, type Resmon.exe in the Open text box, and press Enter. In the Resource Monitor user interface, select the Memory tab, as shown in Figure A.
Figure A
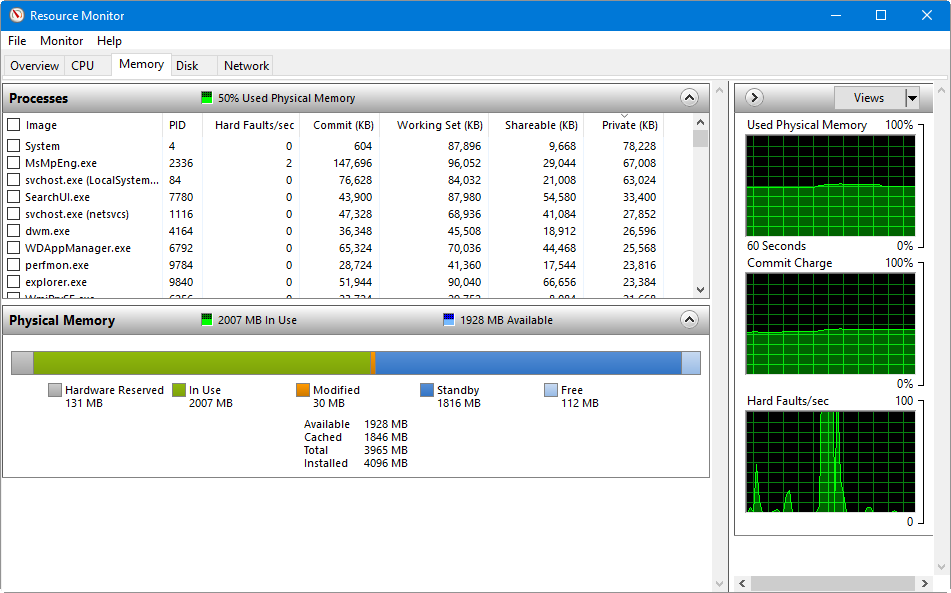
The Memory tab shows detailed information about Windows 10’s memory use.
The graphs
On the right side of Resource Monitor’s Memory tab you’ll see three graphs: Used Physical Memory, Commit Charge, and Hard Faults/Sec.
The Used Physical Memory graph shows a percentage value that represents how much physical memory is in use. The Commit Charge graph shows how much virtual memory is in use. This includes the amount of physical memory that is in use as well as any pages that have been saved in the page file. The Hard Faults/Sec graph shows spikes of activity that represent the occurrence of hard faults.
These graphs display a minute’s worth of activity and run continuously. If you want to examine the activity on a particular graph before it scrolls out of view, pull down the Monitor menu and select the Stop Monitoring command. Select the Start Monitoring command to resume.
The Processes table
On the Memory tab, you’ll find the Processes table, which lists all the currently running processes and breaks down each process’ memory use into various categories (Figure B). Let’s take a more detailed look at each of these categories.
Figure B
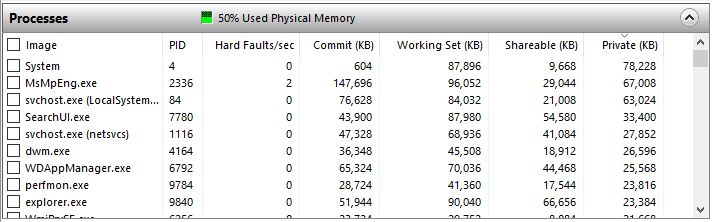
The Processes table breaks down each process’ memory use into several categories.
Image
The Image column shows the process’ executable filename. Processes that represent applications are easy to identify. For instance, it’s obvious that the notepad.exe process corresponds to Notepad. Processes named svchost.exe represent services the OS is running. The name of the service is enclosed in parenthesis next to each instance of svchost.exe listed in the Image column.
PID
The PID column shows the process’ Process ID number–a number that uniquely identifies a process as it runs.
Hard Faults/Sec
The Hard Faults/Sec column shows the average number of hard page faults per second that have occurred in the past minute. If a process tries to use more physical memory than is currently available, the system must write, or page, some of the memory contents to disk. (If the process later needs and accesses the memory contents that exist on the disk, it is called a Hard Fault.)
Commit
The Commit column shows the amount of virtual memory (in kilobytes) the operating system has reserved for a process. This includes the amount of physical memory in use and any pages that have been saved in the page file. Sort by the Commit column to see which processes are using the most memory.
Working Set
The Working Set column shows the amount of physical memory (in kilobytes) currently in use by the process. The working set can be broken down into Shareable and Private categories of memory.
The Sharable column shows the amount of physical memory (in kilobytes) that is currently in use by the process and is shared with other processes. Sharing sections or pages of memory for common processes saves memory space because only one copy of the page is needed. One copy of the page is physically in memory and then it’s mapped to the virtual address space of other processes that need access. For instance, system DLLs, such as Ntdll, Kernel32, Gdi32, and User32, share memory among all processes.
The Private column shows the amount of physical memory (in kilobytes) that is currently in use by the process but is not shared with other processes. This gives you a fairly accurate measure of the amount of memory an application needs in order to run.
Keeping an eye on hard faults
What should you look for when monitoring memory usage? As you load applications and work with files, the OS’s memory manager monitors the working set of each process and watches for requests for more memory resources. As the working set of a process grows, the memory manager balances the process’ demand for more memory against requests for memory from the kernel and other processes. If address space becomes scarce, the memory manager will scale back the size of the working set, typically paging some of the memory contents to disk. If that page must be read back from the disk, it causes a hard fault.
Hard faults are a pretty normal occurrence, but multiple hard faults generally require additional time so that the system can read pages from the disk. If hard faults occur too often, the disk reads will decrease system responsiveness. If you’ve ever been working on your system and suddenly everything seems to run in slow motion and then just as suddenly comes back to regular speed, your system is probably swapping memory around so that it can keep working. If you notice an excessive number of hard faults related to a particular process on a regular basis, chances are good that your system needs more physical memory.
Resource Monitor’s Filtering system can help you watch processes that are encountering a large number of hard faults. Select the check box beside the process to move it to the top of the list. Those hard faults will appear in orange in the Hard Faults/Sec graph.
Note: When it comes to memory usage, many other factors can be involved. Monitoring hard faults isn’t the only or the best way to monitor memory use. But it does provide a good starting point.
The Physical Memory table
The Processes table offers a granular view of memory usage, but the Physical Memory table presents a global view. Its main feature is a bar graph that offers a unique look at memory usage (Figure C).
Figure C
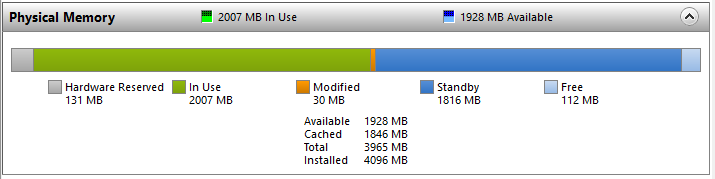
This bar graph shows you a global view of Windows 10’s memory usage.
Each section of the bar graph represents a list of pages of memory. As you use your system, the memory manager works in the background moving memory back and forth between these lists. This enables it to maintain the balance between using physical memory and the hard disk, allowing your system to work most efficiently.
Hardware Reserved
The Hardware Reserved list shows the amount of memory reserved for hardware. It represents the amount of memory your hardware devices have reserved so that they can communicate with the operating system. Memory reserved for hardware is essentially locked so it’s unavailable to the memory manager.
As a general rule, the amount of Hardware Reserved memory ranges from 10 to 70 MB–but it can vary depending on your hardware configuration. In some cases, it might be several hundred MB. Here are some examples of components that can affect the amount of memory reserved:
- System BIOS
- Motherboard resources, such as I/O advanced programmable interrupt controller (APIC)
- Sound cards or other devices that require memory-mapped I/O
- PCI Express (PCIe) bus
- Video card
- Various chipsets
- Flash devices
Note: Some users have reported huge amounts of memory being allocated to the Hardware Reserved list. I haven’t run into this myself so I can’t verify the suggested solution, but a number of people have said that upgrading the system BIOS firmware solved the problem.
In Use
The In Use list appears in green. It indicates the amount of memory being used by the operating system, drivers, and the running processes. This memory is calculated by adding the sizes of the Modified, Standby, and Free values and subtracting the sum from the amount of recognized memory. It’s listed as Total in the section just below the graph. The Total memory is calculated by subtracting any Hardware Reserved memory from the Installed RAM.
Modified
Shown in orange, the Modified list represents the pages of memory that contain data that has been modified but not accessed recently. It’s not technically in use, but it can be pulled into service quickly if needed. If memory in the Modified list has not been accessed in a long time, the memory manager will write the page to disk and move it to the Standby list.
Standby
The Standby list is shown in blue. If contains pages that have been removed from process working sets, but that are still linked to their working sets. The Standby list is basically a cache, but memory pages in the list are prioritized in a range of 0-7 (with 7 being the highest).
A page related to a high priority process will receive a high priority level in the Standby list. For example, processes that are Sharable will be a high priority and pages associated with them will have the highest priority in the Standby list.
If a process needs a page that is associated with the process, and that page is now in the Standby list, the memory manager will return the page to that process’ working set. However, all pages on the Standby list are available for memory allocation requests from any process. When a process requests more memory and there’s not enough in the Free list, the memory manager checks the page’s priority. It will then take a page with a low priority from the Standby list, initialize it, and allocate it to that process.
Free
The Free list appears in light blue. It contains pages of memory that have not yet been allocated to a process or that were previously allocated but returned to the memory manager when the process ended. Note that while “not yet been allocated” and “previously allocated” memory both show in the Free part of the graph, the “not yet been allocated” pages are actually part of another list called the Zero Page list. They’ve been initialized to zero and are ready for use when the memory manager needs a new page.
A misconception
There’s a common misconception with Windows 10’s memory management scheme. As we saw in Figure C, Free memory is the second smallest list in the graph. Many users think that means Windows 10 is a memory hog. They wonder how a system can run effectively when there is hardly any Free memory.
In fact, the opposite is true. With Windows 10’s memory management scheme, Free memory is wasted memory. The more memory Windows 10 keeps in play, the better. By using all available memory and juggling pages between the lists, along with using its Standby priority system, Windows 10 can help keep memory pages from hitting the page file, where hard faults and sluggish performance are likely to occur.
Watching memory use
To demonstrate Windows 10’s memory management scheme, restart your system. After you log in, launch Resource Monitor, select the Memory tab, and note the size of the lists on the Physical Memory bar graph.
Next, begin loading applications. Lots of them. The bigger, the better. As each application loads, switch to Resource Monitor and watch the size of the lists on the Physical Memory graph change. When you finish loading apps, begin closing them. Switch back to Resource Monitor and again watch the size of the lists change.
This exercise will give you a good look at how Windows 10’s memory management scheme works on your system. Now you can use Resource Monitor to keep tabs on memory usage during a normal computing session.
Also read…
- Microsoft’s Magic Mirror will recognize human faces and emotions
- Configure Outlook’s Calendar view to suit your work routine
- How to use PowerShell modules to knock out your admin chores
- Microsoft Surface Book: The smart person’s guide
What’s your take?
Do you use Resource Monitor to keep an eye on memory usage? Share your advice and experiences with fellow TechRepublic members.