
.webp "Dell Logo")

Executive Summary
As agentic AI reshapes enterprise deployment, economic impact has become the leading metric organizations use to justify AI investment, according to Futurum Research
The Dell AI Factory with NVIDIA datacenter solutions can achieve up to 68% savings and deskside solutions can achieve up to 90% savings vs. public cloud. Compared with frontier APIs, savings can reach up to 94% for datacenter solutions and 98% for deskside solutions.
This report evaluates the economics of running agentic AI workloads on premises with the Dell AI Factory with NVIDIA compared to open-weight and leading frontier cloud hosted models. The study utilizes performance results from nine distinct Dell platforms, modeling three separate agentic workloads over a 2 year time horizon.
Key findings include:
- The Dell AI Factory with NVIDIA portfolio delivers cost-optimized solutions across every workload profile evaluated. The configurations evaluated pair Dell systems with NVIDIA GPUs and Nemotron™ 3 models; the modeled datacenter configurations also include NVIDIA AI Enterprise software.
- Dell AI solutions achieved a cost advantage in all configurations evaluated against AWS Bedrock and leading frontier APIs, with savings ranging from 8% to 98%.
- Advantages hold from single-workstation pilots through multi-server production deployments, across low, medium, and high task complexity, and across model sizes from 30 billion to 120 billion parameters
- The largest configuration evaluated supported over 30,000 concurrent agents, while the architecture enables further scaling with additional nodes
- Compared to open-weight model pricing on AWS Bedrock, Dell AI Factory with NVIDIA datacenter solutions achieve up to 68% savings and Dell deskside solutions achieve up to 90% savings.
- Compared to leading frontier API costs, Dell AI Factory with NVIDIA datacenter solutions achieve up to 94% savings and deskside solutions achieve up to 98% savings.
The Case for On-Premises Agentic AI
Enterprise AI adoption is rapidly shifting from experimentation to execution, and increasingly, that execution is agentic. According to Futurum Research, 93% of enterprises are already researching, piloting, or deploying AI agents
Early enterprise AI deployments have largely relied on cloud-hosted models due to their accessibility, scalability, and consumption-based pricing. Cloud providers offer on-demand access to both open-weight models, such as those that can be run on-premises, and several other popular leading frontier models— some of which can also be run on-premises, all at varying token-based pricing. While well suited for bursty workloads and specialized services, ongoing agentic AI workloads fundamentally change this economic model. Autonomous AI agents can operate continuously, generating sustained inference demand and significantly increasing long-term token consumption. Compared to standard chat interactions, agentic workloads consume orders of magnitude more tokens with agents easily utilizing 4x to 15x more tokens. As agentic workloads continue to evolve, token growth is expected to grow even further, with autonomous agents driving up to 1000x more inference demand than reasoning AI.
Along with an exponential increase in token usage, autonomous AI agents reduce the latency thresholds typically found in traditional interactive AI applications. While live users require rapid responses to maintain user experience, agents can be served intermittently, allowing the same hardware to support far more concurrent agents than real-time interactive users. Together, these two shifts – higher token volume and lower latency requirements – move the economics of AI infrastructure toward on-premises deployment.
Beyond economics, on-premises deployment offers several additional strategic advantages for enterprise organizations. Keeping inference on-premises avoids round-trip latency to cloud APIs and keeps sensitive data within an organization's own security and governance boundary rather than transmitting it to a third party. For agents that repeatedly query proprietary data sources, it avoids the cost and complexity of continuously moving that data to and from the cloud. Finally, on-premises infrastructure gives organizations direct ownership over their AI workloads, independent of a provider's pricing changes, rate limits, model deprecations, or service availability.
Dell and NVIDIA have a solution:
The Dell AI Factory with NVIDIA provides an alternative to cloud APIs, enabling organizations to run agentic workloads of all sizes on-premises, gaining these strategic advantages and avoiding costly per-token pricing. The Dell AI Factory with NVIDIA portfolio ranges from PCs, to workstations, to enterprise grade PowerEdge servers, all capable of producing and consuming tokens to support concurrent agents. This analysis examines the economics of deploying agentic AI workloads on-premises with Dell AI Factory with NVIDIA versus cloudbased APIs.
This analysis utilizes hands-on performance testing combined with Dell pricing data to model the economics of three enterprise workload profiles: an AI-Agent Assisted Knowledge Worker, an AI-Enabled Sales Agent, and AI-Agent Software Development. Each workload is then compared to two distinct cloud competitors – the same open-weight model hosted on AWS Bedrock, and a similarly sized leading frontier API-based model. Notably, the Dell AI Factory with NVIDIA portfolio was found to achieve significant advantages during all workloads modeled, with a variety of solutions well fit for varying enterprise scales and use cases.
Methodology
To evaluate the economics of agentic AI, Signal65 conducted a comparison of Dell AI Factory with NVIDIA solutions compared to cloud competitors. Performance testing was conducted across multiple hardware platforms and utilized as the basis of each comparison. Not every workload was tested across every combination of LLM and hardware platform. Platforms evaluated can be seen below:
System | GPUs |
|---|---|
| Dell Pro Precision with GB10 | 1x NVIDIA GB10 Blackwell |
| Dell Pro Precision with GB300 | 1x NVIDIA GB300 Blackwell 1x NVIDIA RTX PRO™ 2000 Blackwell Workstation Edition |
| Dell Pro Precision Series 9 T2 | 1x NVIDIA RTX PRO™ 6000 Blackwell Workstation Edition (600W) |
| Dell Pro Precision Series 9 T4 | 2x NVIDIA RTX PRO™ 6000 Blackwell Max-Q Workstation Edition |
| Dell Pro Precision Series 9 T6 | 5x NVIDIA RTX PRO™ 6000 Blackwell Max-Q Workstation Edition |
| 4x Dell PowerEdge XE7740 | 32x NVIDIA RTX PRO™ 6000 Blackwell Server Edition |
| 16x Dell PowerEdge XE7740 | 128x NVIDIA RTX PRO™ 6000 Blackwell Server Edition |
| 16x Dell PowerEdge XE7745 | 128x NVIDIA RTX PRO™ 4500 Blackwell Server Edition |
| Dell PowerEdge XE7745 | 8x NVIDIA H200 NVL |
| 4x Dell PowerEdge XE9780 | 32x NVIDIA B300 Blackwell Ultra SXM |
Figure 1: Dell AI Factory with NVIDIA Platforms
Key On-premises Assumptions:
- Deskside solutions are modeled with open-source inference software, with on-premises energy costs included in the cost basis.
- Datacenter solutions additionally include management nodes, networking, and storage sufficient to support the tested configuration; NVIDIA AI Enterprise software; and Dell deployment and support services. Energy, colocation, and infrastructure maintenance costs are included in the annual cost basis.
- Power draw for the annual energy cost calculation is based on an assumed 80% of each solution's maximum rated power draw.
- Hardware costs are amortized over a two-year period.
- Working cost of capital, depreciation, and other accounting methodologies were not included in this analysis.
Signal65 Comment: This analysis models cost comparisons over a two-year time horizon, reflecting the pace of change in the underlying technology: GPU architectures, model releases, and cloud pricing structures can all shift significantly over this period. In practice, Dell hardware is expected to remain in productive service beyond this two-year window, consistent with typical three-to-five-year enterprise hardware refresh cycles. This makes the two-year model conservative: any additional years of service would continue to offset ongoing cloud spend without adding to the hardware's amortized cost, extending the cost advantages shown throughout this analysis beyond what is reflected here.
Agentic workloads are sized against a 10 tokens/sec-per-agent threshold. This threshold was chosen as a representative value for the relaxed latency conditions that AI agents operate in. A background agent does not need to provide instantaneous responses to an interactive user, instead its requirements are simply to achieve enough sustained throughput to complete its daily token volume.
To map the performance results to real agentic workloads, three distinct agent workloads were defined: an AI-Agent Assisted Knowledge Worker, an AI-Enabled Sales Agent, and AI-Agent Software Development. Each agent workload varies in complexity, overall token usage, operational autonomy, and model requirements.
| Agent | Model Basis | Annual Input Per Agent | Annual Input Per | Days Operating/Yr |
|---|---|---|---|---|
| AI-Agent Assisted Knowledge Worker | NVIDIA Nemotron™ 3 Nano | 3,414,528,000 | 53,352,000 | 260 |
| AI-Enabled Sales Agent | NVIDIA Nemotron 3 Nano / NVIDIA Nemotron™ 3 Super 50-50 blend | 4,142,361,600 | 64,724,400 | 260 |
| AI-Agent Software Development | NVIDIA Nemotron™ 3 Super | 7,396,480,000 | 115,570,000 | 350 |
Figure 2: AI Agent Workloads
NVIDIA Nemotron™ 3 was selected as the primary model family for sizing the three core agent personas in this study. NVIDIA develops the Nemotron 3 family of open models in-house and optimizes it specifically for its own GPU architectures, making it a natural fit for isolating hardware economics without conflating them with a third-party model's independent efficiency characteristics. The family is open-weight, which is a practical requirement for this analysis. NVIDIA Nemotron 3 models also span a wide parameter range under one consistent architecture allowing this study to hold model family constant while varying only size and task complexity across personas. Considering a vendor’s headquarters and the legal and regulatory framework under which it operates is also a crucial factor for companies evaluating AI model provenance during vendor and compliance assessments.
Key Workload Assumptions:
- Utilization: 80% across all three workloads. Higher utilization would result in increased token usage and further improve the advantages found in this report.
- Token Ratio: An assumed 64:1 input to output token ratio was assumed for all workloads. To approximate this, benchmarking results at 6,400 input / 100 output tokens were utilized.
- Days/Year:
- Knowledge Worker and Sales agents were assumed to run for 260 days a year, in line with the standard number of working days, as these agents typically depend on customer and colleague availability.
- Software Development runs 350 days/yr. This workload is assumed to be an autonomous coding agent that does not regularly require a human counterpart present and can run consistently most days of the year.
Signal65 Comment: The 64:1 input to output token ratio was chosen as a realistic, yet conservative estimate. In many cases, agentic workloads can utilize even higher token ratios, such as 100:1. This can further accelerate on-premises economic advantages beyond what is modeled in this report.
Each agentic workload was additionally modeled across two cloud competitors: AWS Bedrock and a leading frontier AI API provider. AWS Bedrock was utilized to provide direct cloud comparisons of the models run on-premises. The leading frontier API competitor represents different models at comparative sizes that would additionally be popular choices for enterprises conducting these workloads.
| Model | Parameter Size | Provider | Input $/M | Output $/M | Cached $/M |
|---|---|---|---|---|---|
| NVIDIA Nemotron 3 Nano | 3.6B Active / 31.6B Total | AWS Bedrock | $0.06 | $0.24 | - |
| NVIDIA Nemotron 3 Nano/ NVIDIA Nemotron 3 Super 50-50 blend | Blended | AWS Bedrock | $0.105 | $0.445 | - |
| NVIDIA Nemotron 3 Super | 12B Active / 120B Total | AWS Bedrock | $0.15 | $0.65 | - |
| Leading Frontier API (small) | N/A | Leading Frontier API | $1.00 | $5.00 | $0.10 |
| Leading Frontier API (small / large blend) | N/A | Leading Frontier API | $1.50 | $7.50 | $0.15 |
| Leading Frontier API (large) | N/A | Leading Frontier API | $2.00 | $10.00 | $0.20 |
Figure 3: Cloud Model Costs
Signal65 Comment: Comparisons to the leading frontier API provider are intended as a practical price comparison, and not a direct match for model capability. These offerings represent popular AI model choices that are often chosen for these workloads; however, the models are not functionally the same as those tested on premises or in AWS Bedrock. Notably, the frontier API token prices may already be subsidized and may fluctuate over time.
Key Cloud Assumptions:
Cache hit rate
A token cache rate of 25% is assumed for the leading frontier API provider’s published cached-input tier. AWS Bedrock did not have cached token pricing available. The selected token cache rate reflects agentic coding workloads, where tool-calling and rework disrupt the stable prompt prefix caching depends on.
Cloud Overhead
For AWS Bedrock, additional overhead was included in the price, calculated at 25% of the calculated token costs. This overhead reflects a broader cloud operating stack beyond model inference alone, including Bedrock Guardrails, vector database and RAG indexing, observability and runtime tooling, application-layer retry and connection infrastructure, and associated SRE and security operations effort. In practice, these overhead fees will vary depending on the specific workload requirements. Dell datacenter configurations include NVIDIA AI Enterprise, which covers a comparable serving, guardrails, and support stack; Dell deskside configurations are modeled as open-source software deployments without an equivalent managed-service layer.
Cloud Discounts
Token costs for the leading frontier API provider are notably higher than comparable open-weight models hosted on AWS Bedrock. Enterprise agreements at this scale routinely include negotiated discounts, so comparing against undiscounted list pricing would overstate the leading frontier provider's real-world cost. To create a fair comparison, a 40% discount was applied to all leading frontier API fees. AWS Bedrock is not separately discounted; the 25% overhead above is itself a net figure, reflecting an estimated gross overhead of roughly 45% against an assumed 20% enterprise discount on Bedrock model token spend.
Pricing Stability and Cross-Provider Context
Cloud API pricing is not static, and providers periodically adjust rates as new models are released and market conditions shift. To ground this analysis in realistic terms, list pricing for the leading frontier API used in this study was checked against publicly available pricing from other major frontier-model providers as of publication. Prices vary by vendor and by model tier, but the leading frontier API pricing used here sits within the range observed across providers rather than at either extreme. The 40% enterprise discount applied throughout this analysis is a conservative assumption relative to the negotiated rates many organizations report at this scale, and can account for variation between providers or future pricing changes. Because list pricing will continue to change, the specific ratios and breakeven timelines in this report should be read as representative of current market conditions rather than fixed values; the underlying methodology and general findings remain consistent.
Findings
AI-Agent Assisted Knowledge Worker: Big Savings from Lightweight AI
Not every AI workload demands massive infrastructure. The AI-Agent Assisted Knowledge Worker represents a lightweight agent handling everyday workplace tasks, like internal Q&A, document summarization, and basic research assistance. It's the least demanding workload in this study, powered by the smallest model evaluated: NVIDIA Nemotron 3 Nano. However, lightweight does not equate to low value. These tasks drive day-to-day operations across a wide range of roles, and automating them with agentic AI delivers significant value, time savings, and efficiency.
When running this workload, the Dell AI Factory with NVIDIA portfolio was found to support between 26 and 33,821 concurrent agents depending on the selected platform. Every configuration modeled achieved an economic advantage, against both AWS Bedrock and the leading frontier API.
System evaluated | # of Agents |
|---|---|
| Dell Pro Precision with GB10 | 26 |
| Dell Pro Precision Series 9 T2 (1x NVIDIA RTX PRO 6000 Blackwell Workstation Edition GPU) | 302 |
| Dell Pro Precision Series 9 T4 (2x NVIDIA RTX PRO 6000 Blackwell Max-Q Workstation Edition GPUs) | 327 |
| Dell Pro Precision with GB300 | 379 |
| Dell Pro Precision Series 9 T6 (5x NVIDIA RTX PRO 6000 Blackwell Max-Q Workstation Edition GPUs) | 560 |
| Dell PowerEdge XE7745 (8x NVIDIA H200 NVL GPUs) | 2,703 |
| 4x Dell PowerEdge XE7740 (32x NVIDIA RTX PRO 6000 Blackwell Server Edition GPUs) | 8,455 |
| 16x Dell PowerEdge XE7745 ( 128x NVIDIA RTX PRO 4500 Blackwell Server Edition GPUs) | 8,455 |
| 4x Dell PowerEdge XE9780 (32x NVIDIA B300 Blackwell Ultra GPUs) | 16,156 |
| 16x Dell PowerEdge XE7740 (128x NVIDIA RTX PRO 6000 Blackwell Server Edition GPUs) | 33,821 |
Figure 4: AI-Agent Assisted Knowledge Worker Agents
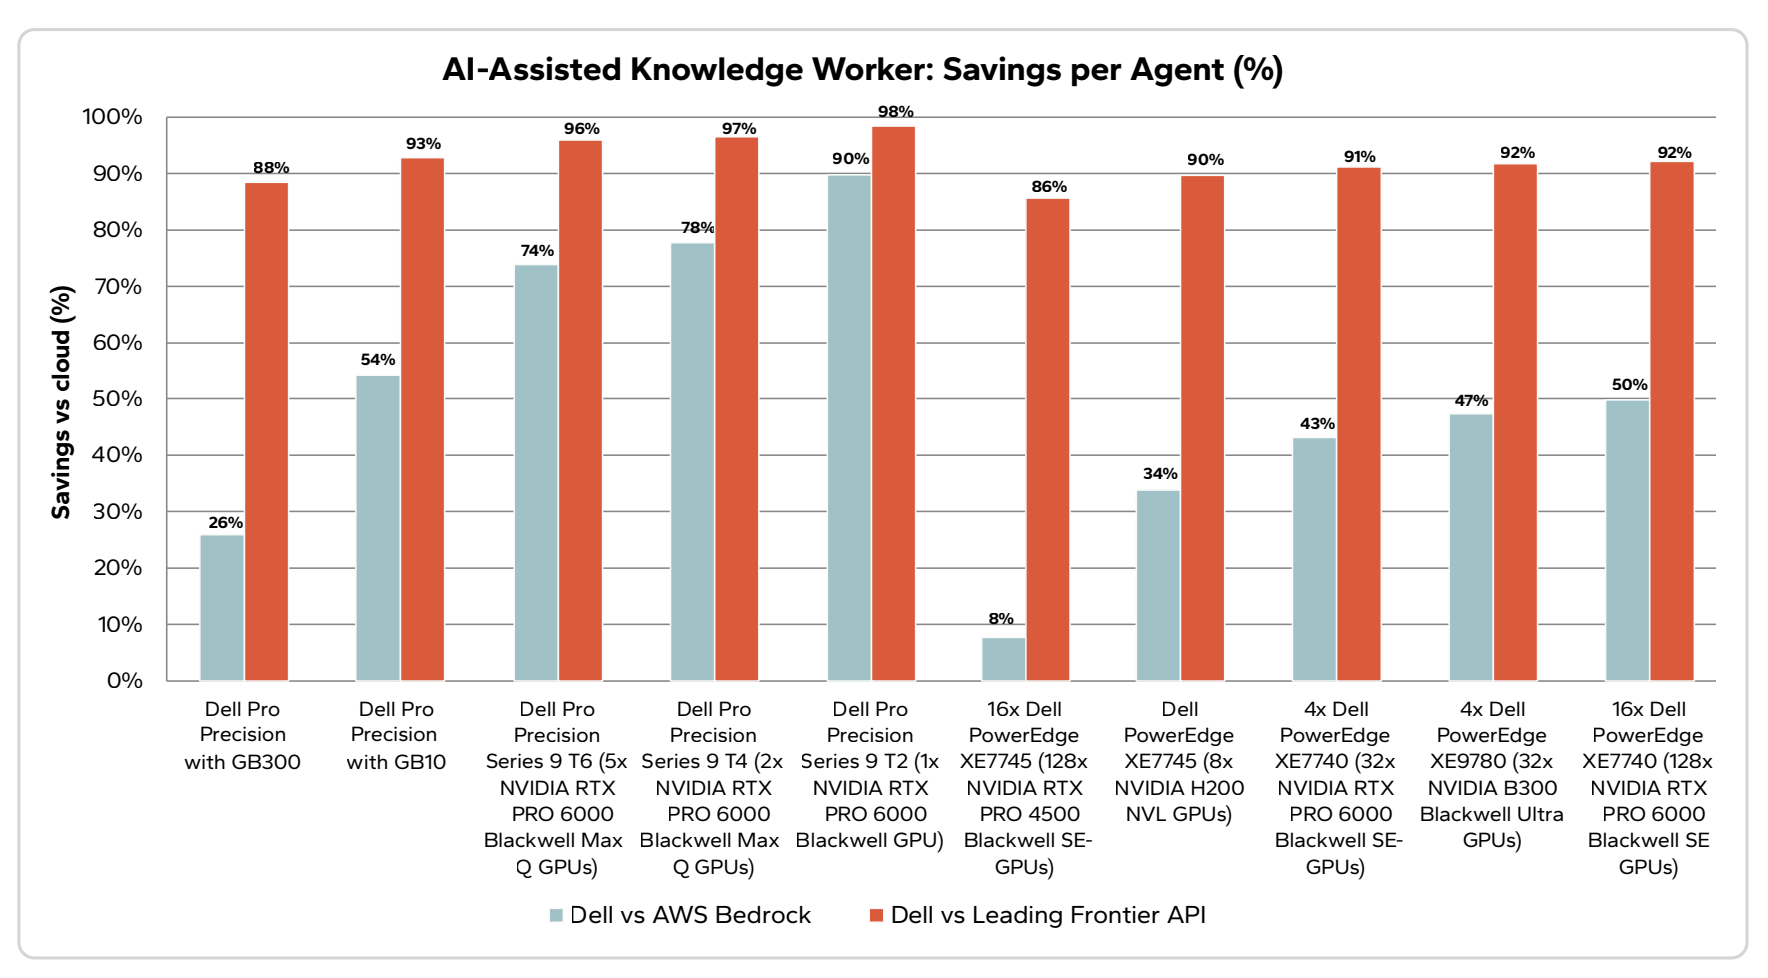
Figure 5: AI-Agent Assisted Knowledge Worker Comparison
Across every Dell solution evaluated for the AI-Agent Assisted Knowledge Worker workload, Dell delivered a cost advantage against both AWS Bedrock and the leading frontier API, with savings ranging from 8% to 90% against Bedrock and 86% to 98% against the leading frontier API.
Starting small
The Dell Pro Precision with GB10, the smallest system in this analysis, supports 26 agents at cost advantages of 54% against AWS Bedrock and 93% against leading frontier APIs. This is real, production-ready capability for general-purpose knowledge agents in a compact footprint.
Scaling through workstations
The Dell Pro Precision Series 9 T2, Dell Pro Precision Series 9 T4, Dell Pro Precision Series 9 T6, and Dell Pro Precision with GB300 configurations extend reach from 302 to 560 agents, with cost advantages ranging from 26% to 98%.
Stepping into the datacenter
The Dell PowerEdge XE7745 with 8x NVIDIA H200 NVL GPUs marks the transition from deskside to datacenter infrastructure, supporting 2,703 agents — nearly five times the largest deskside configuration — at cost advantages of 34% against AWS Bedrock and 90% against leading frontier APIs. For organizations scaling lightweight workloads, such as knowledge-work agents, it delivers server-class capacity at the lowest entry price of any datacenter solution evaluated.
Reaching enterprise scale
The Dell PowerEdge servers demonstrate how this workload scales to large agent fleets without sacrificing its cost advantage, seen across three distinct cluster configurations. The three tiers also fit different needs: RTX PRO 4500-based servers suit AI inference in low-power, space-constrained environments; RTX PRO 6000-based servers suit higher-performance inference; and B300-based servers extend performance further, reaching beyond the inference workloads tested here into fine-tuning. The 16x Dell PowerEdge XE7745 with 128x NVIDIA RTX PRO 4500 Server Edition GPUs supports over 15,000 agents at 8% lower cost than AWS Bedrock and 86% lower cost than leading frontier APIs. The Dell PowerEdge XE7740 with NVIDIA RTX PRO 6000 Server Edition GPUs scales from 8,455 agents in a four-node cluster to over 33,000 agents in a 16-node cluster — the largest single-deployment population of any workload in this study. Both Dell PowerEdge XE7740 configurations achieve significant cost advantages, ranging from 43% to 50% compared to AWS Bedrock and over 90% compared to leading frontier APIs. This trend of large savings at enterprise scale continues with the 4x Dell PowerEdge XE9780 cluster with 32x NVIDIA B300 Blackwell Ultra GPUs. At an estimated annualized cost of $2.3M, compared to $4.4M on AWS Bedrock and $28.2M through leading frontier APIs, it delivers two-year savings of $4.2M and $51.8M, respectively. The 16-node XE7740 cluster goes further still: it delivers two-year savings of $9.2M against AWS Bedrock and $109.0M against leading frontier APIs.
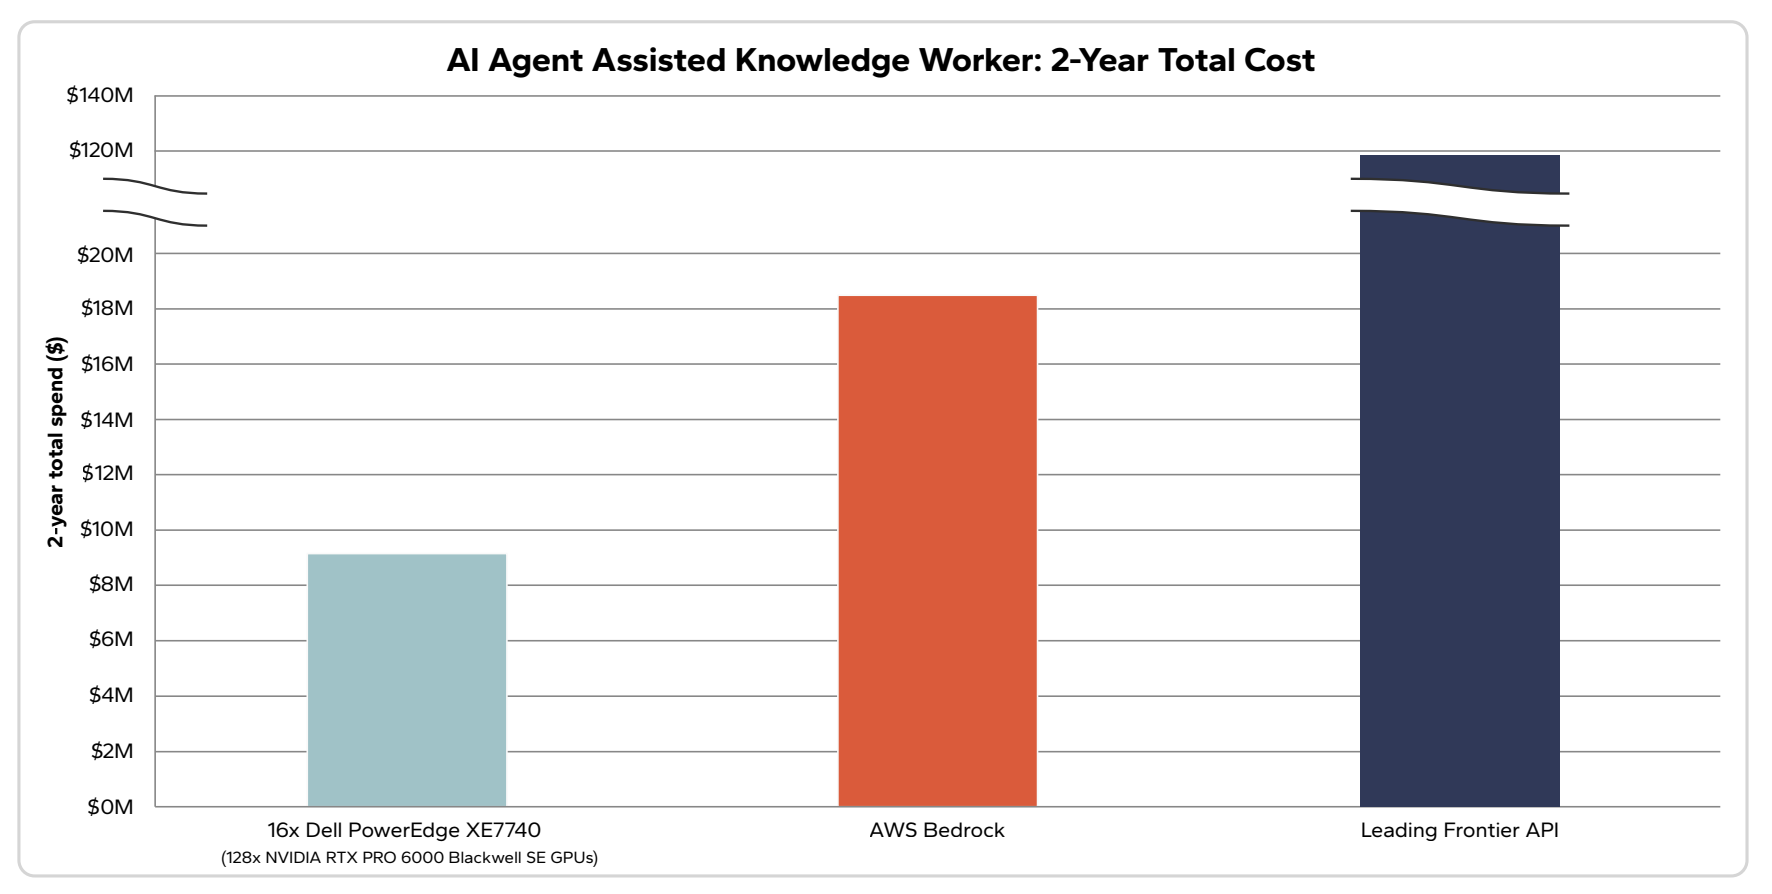
Figure 6: Total Two Year Cost (AI-Agent Assisted Knowledge Worker)
The 16x PowerEdge XE7740 with 128x NVIDIA RTX PRO 6000 Blackwell Server Edition GPUs running the Knowledge Worker workload saves an estimated $9.2M over two years against AWS Bedrock and $109.0M against the leading frontier API.
AI-Enabled Sales Agent: Balanced Complexity, Consistent Savings
Different workloads benefit from different models, harnesses, and supporting infrastructure. The AI-Enabled Sales Agent is a useful illustration: it is the one workload in this study modeled across two models, blending NVIDIA Nemotron 3 Nano (30B) for routine tasks with NVIDIA Nemotron 3 Super (120B) for more complex ones, and its results reflect the combined cost of serving both. In production, organizations should expect similar orchestration, along with agent harnesses that manage tool calls, retries, and routing between models of different sizes.
Sales workloads in particular tend to require substantial connectivity to internal data — CRM records, customer history, pricing, and product information — typically through retrieval systems that sit alongside the model itself. These data requirements were not part of this analysis and are not reflected in the quantified results, but they are an important consideration for any organization planning a deployment, and they are a factor that tends to favor keeping inference close to the data. This is consistent with Futurum Research on enterprise sales AI, which finds that agent performance depends heavily on access to clean, connected internal data – reinforcing that data proximity can impact both performance and cost
System evaluated | # of Agents |
|---|---|
| Dell Pro Precision Series 9 T2 (1x NVIDIA RTX PRO 6000 Blackwell Workstation Edition GPU) | 97 |
| Dell Pro Precision Series 9 T4 (2x NVIDIA RTX PRO 6000 Blackwell Max-Q Workstation Edition GPUs) | 105 |
| Dell Pro Precision with GB300 | 225 |
| Dell Pro Precision Series 9 T6 (5x NVIDIA RTX PRO 6000 Blackwell Max-Q Workstation Edition GPUs) | 305 |
| 4x Dell PowerEdge XE9780 (32x NVIDIA B300 Blackwell Ultra GPUs) | 8,676 |
Figure 7: AI-Enabled Sales Agents
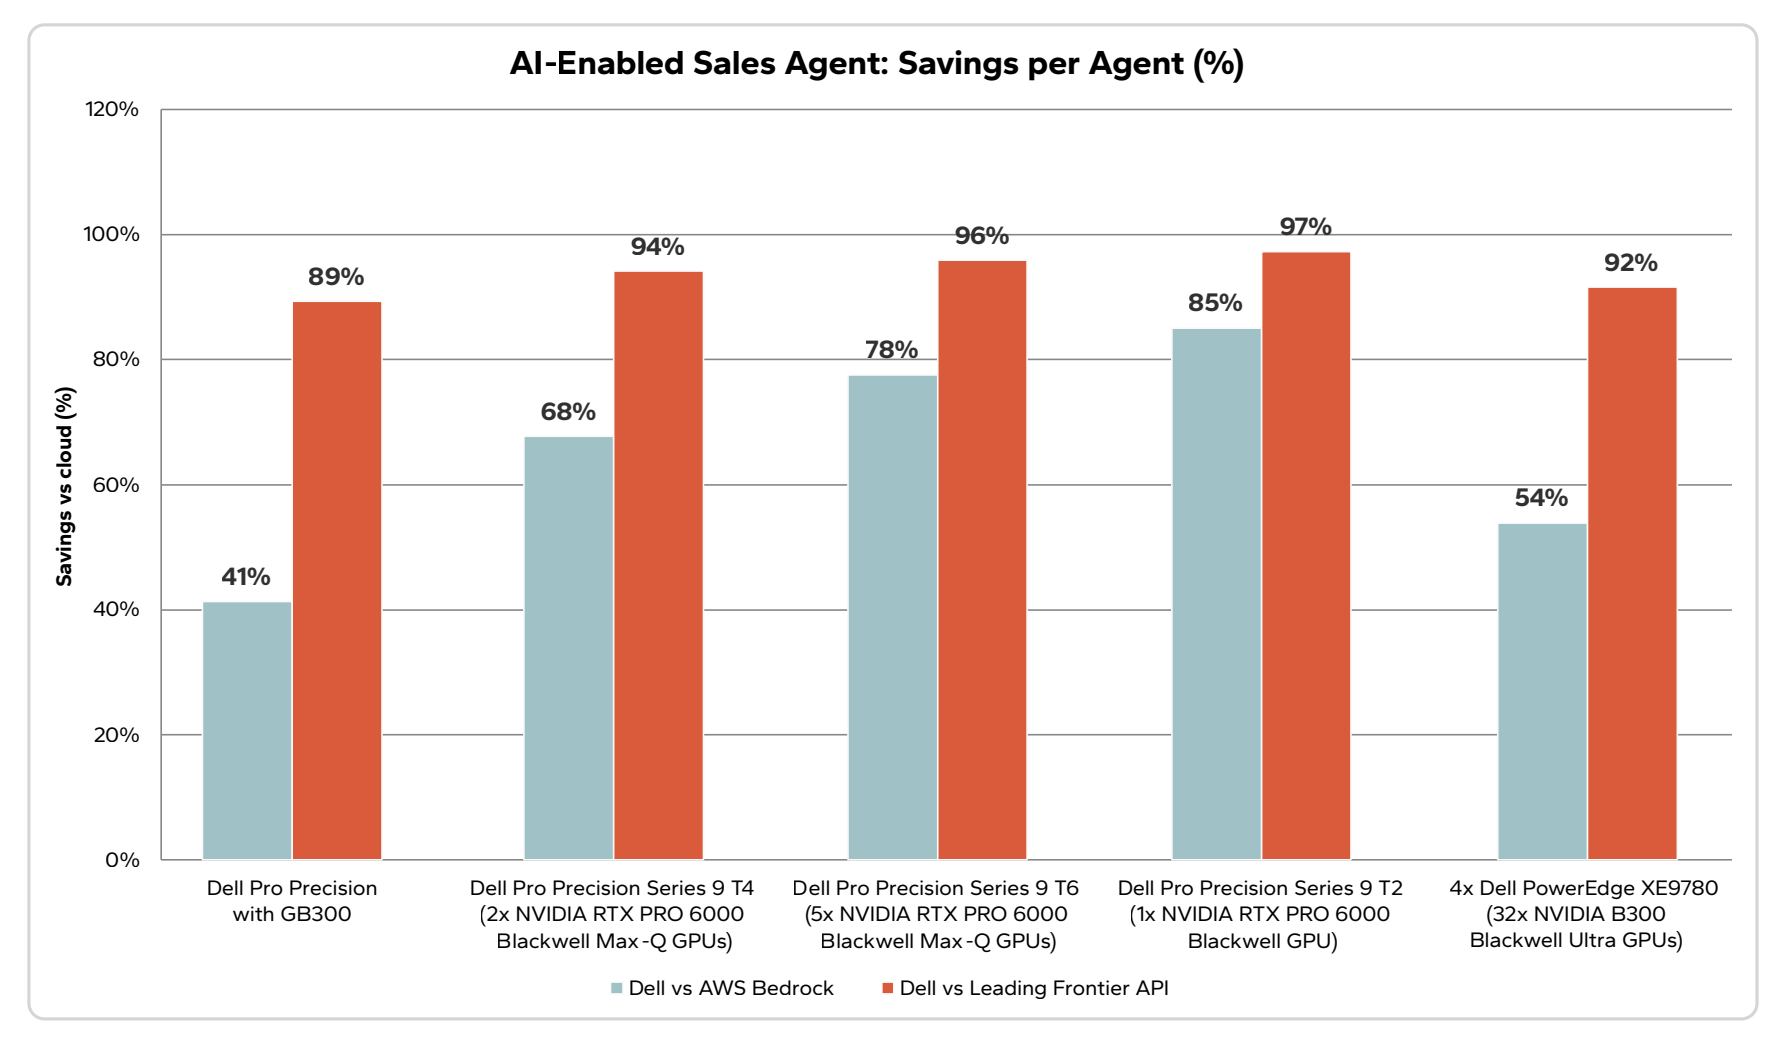
Figure 8: AI-Enabled Sales Agent Comparison
Dell achieved a cost advantage in every configuration evaluated for the AI-Enabled Sales Agent workload, with savings ranging from 41% to 85% against AWS Bedrock and 89% to 97% against the leading frontier API.
When modeled against the AI-Enabled Sales Agent Workload, the Dell AI Factory with NVIDIA portfolio achieved a cost advantage in every configuration evaluated. The modeled solutions scaled from 97 agents on the Dell Pro Precision Series 9 T2 to 8,676 on the 32x NVIDIA B300 Blackwell Ultra GPU cluster.
Fast payback, even at higher complexity
As a blend of NVIDIA Nemotron 3 Nano and NVIDIA Nemotron 3 Super, this workload's resource requirements per agent are higher than the Nano-only Knowledge Worker workload, but lower than the most complex Software Development workload. Despite the more complex workload, Dell still achieves consistent advantages across all comparisons. Every configuration reached breakeven against AWS Bedrock within 14 months, and all configurations reached breakeven against the leading frontier API within 5 months.
Cost advantages at medium to large scales
The Dell Pro Precision Series 9 T2 delivers the strongest single-system result in this workload with 85% lower cost than AWS Bedrock and 97% lower than leading frontier APIs. With support for 97 agents running in a mixed-model configuration, the Dell Pro Precision Series 9 T2 provides an advantageous entry point to deploy complex agentic AI on a deskside solution. For organizations requiring larger scales, Dell AI Factory with NVIDIA deskside solutions maintain significant cost advantages ranging from 41% to 97% less than cloud competitors and supporting up to 305 agents.
Large-scale savings at enterprise-scale
For enterprise-grade, production-scale deployments the 4x PowerEdge XE9780 with 32x NVIDIA B300 Blackwell Ultra GPU cluster supports 8,676 agents at 54% lower cost than AWS Bedrock, and 92% lower cost than leading frontier APIs. Over two years, this represents savings of $5.4M and $50.6M.
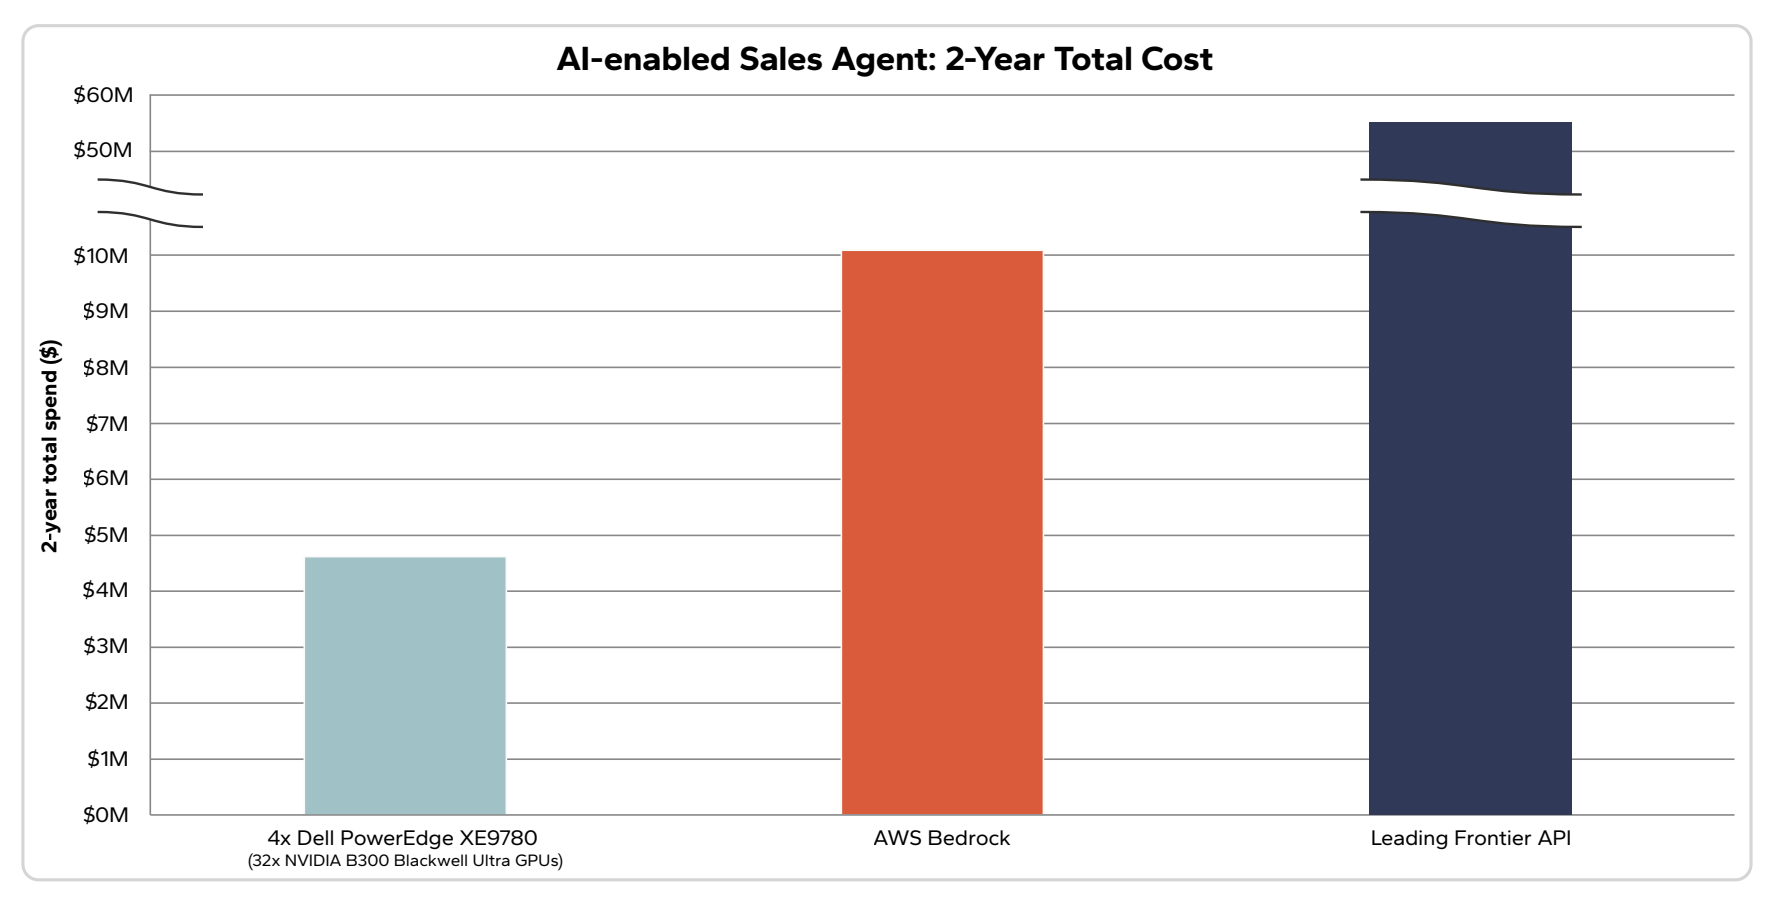
Figure 9: Total Two Year Cost (AI-Enabled Sales Agent)
At cluster scale, the 4x PowerEdge XE9780 running the Sales Agent workload saves an estimated $5.4M over two years against AWS Bedrock and $50.6M against the leading frontier API.
AI-Agent Software Development: Maximum Complexity, Maximum Savings
The AI-Agent Software Development workload represents the most complex and resource-intensive of the three workloads modeled, supporting complex tasks such as code generation, debugging, and code review.
Due to the complex nature of software development tasks, this workload utilizes a large, 120B parameter model – NVIDIA Nemotron 3 Super. Beyond the task requirements and the model size, this workload additionally distinguishes itself as a highly autonomous, always on workload. While agents can automate knowledge work or sales initiatives, they typically still rely on additional human counterparts during standard working hours, such as customer feedback or client interaction. Software development, however, can much more easily run autonomously without interruption during weekends or nights. Because of this, the model for this workload assumes extended operational time at 350 days. This extension further drives the demanding nature of the workload and amplifies the overall token requirements.
| System evaluated | # of Agents |
|---|---|
| Dell Pro Precision with GB10 | 2 |
| Dell Pro Precision Series 9 T2 (1x NVIDIA RTX PRO 6000 Blackwell Workstation Edition GPU) | 45 |
| Dell Pro Precision Series 9 T4 (2x NVIDIA RTX PRO 6000 Blackwell Max-Q Workstation Edition GPUs) | 49 |
| Dell Pro Precision with GB300 | 132 |
| Dell Pro Precision Series 9 T6 (5x NVIDIA RTX PRO 6000 Blackwell Max-Q Workstation Edition GPUs) | 172 |
| 4x Dell PowerEdge XE9780 (32x NVIDIA B300 Blackwell Ultra GPUs) | 4,850 |
Figure 10: AI-Agent Software Development Agents
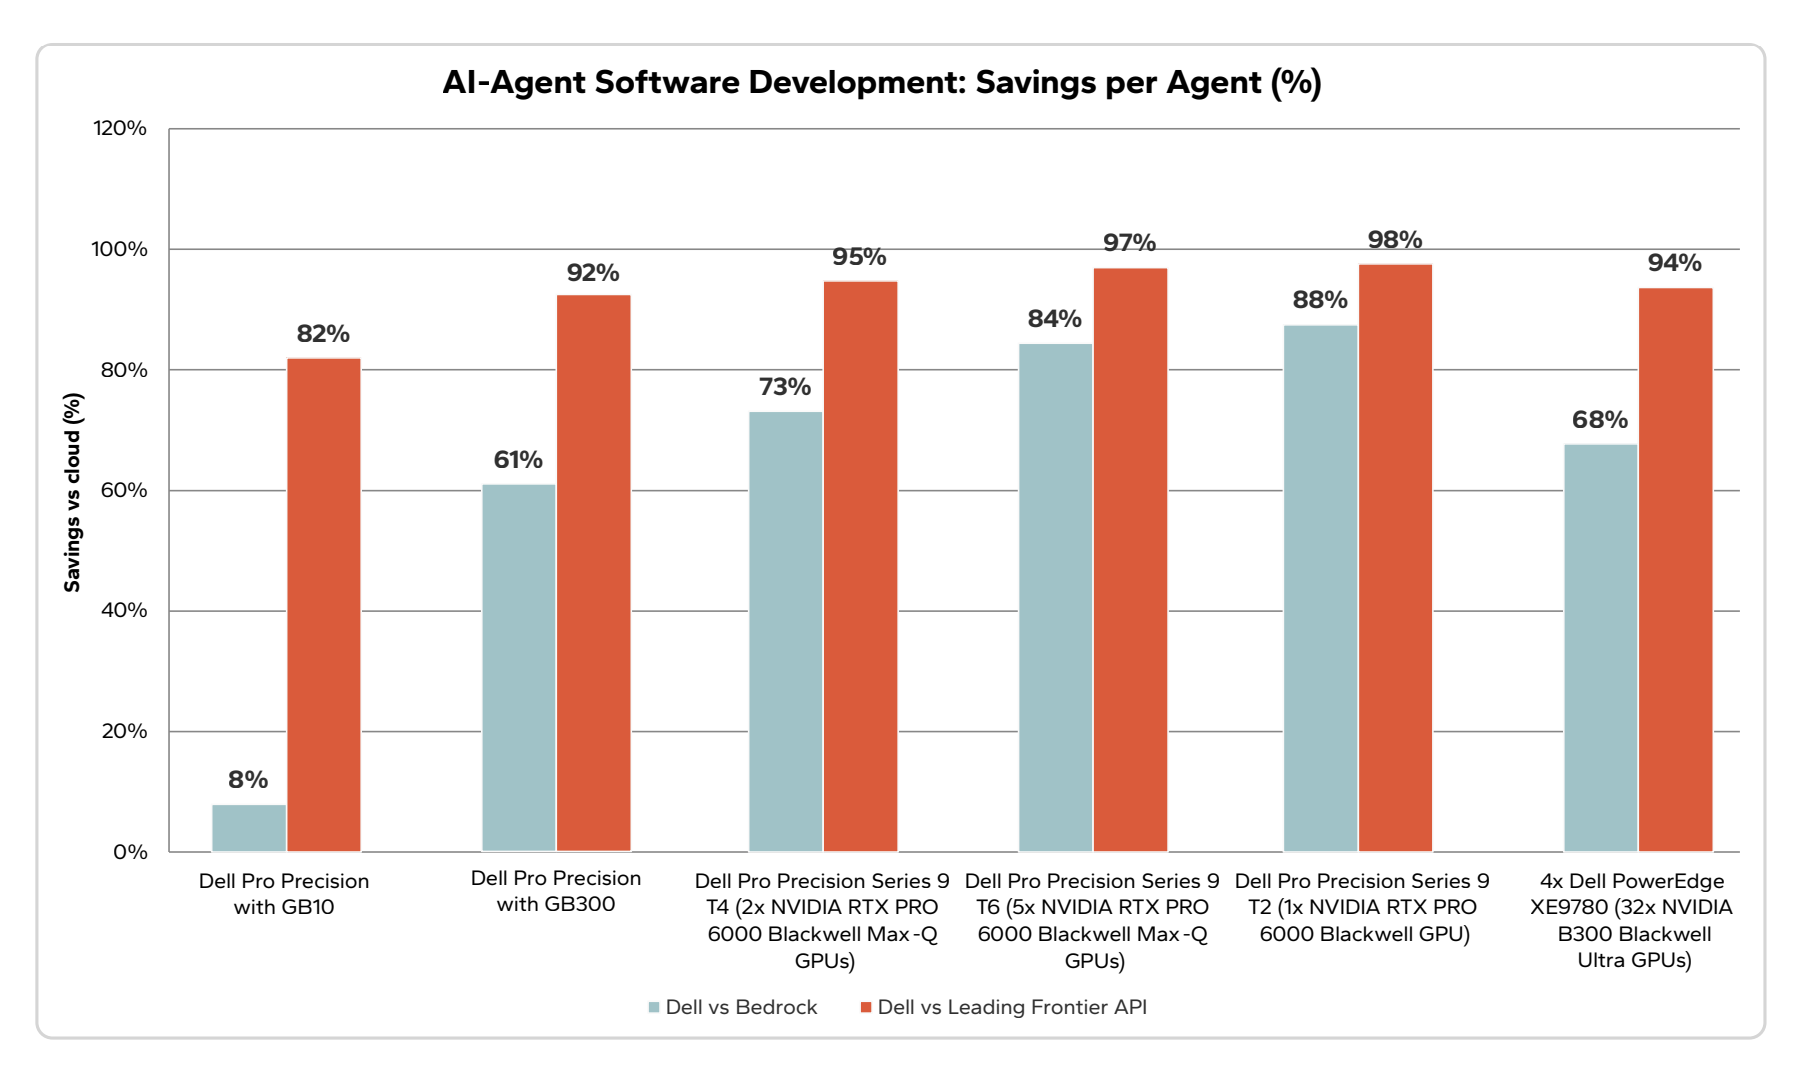
Figure 11: AI-Agent Software Development Comparison
Across all configurations evaluated for the AI-Agent Software Development workload, Dell maintained a cost advantage against both cloud comparators, with savings ranging from 8% to 88% against AWS Bedrock and 82% to 98% against the leading frontier API.
Dominant economics across the portfolio
Dell achieved an economic advantage in every configuration evaluated, with cost savings ranging from 8% to 88% against AWS Bedrock and 82% to 98% against leading frontier APIs. This is a meaningful result given the large model and complex nature of the software development workload. Even under resource-intensive agentic workloads, Dell’s on-premises economics hold up across the portfolio.
Small advantages still carry value
The Dell Pro Precision with GB10 achieves only a modest cost advantage compared to AWS Bedrock, but even at near cost parity, on-premises can still be a strategic choice for many organizations. Keeping workloads local gives organizations greater control over data privacy, security, and governance without exposure to future cloud pricing changes. The GB10 is limited in agent capacity for such a demanding workload served by a 120B parameter model, but the result still demonstrates something meaningful: the ability to run a large, complex workload on a small, edge-deployable system.
The Dell Pro Precision Series 9 T2 stands out again
As with the previous workloads, the Dell Pro Precision Series 9 T2 delivers the strongest economics, achieving an 88% cost advantage against AWS Bedrock with a 2.5-month payback period. This is consistent with the T2's performance across all three workloads in this study, where it delivers the highest cost advantage against AWS Bedrock of any system evaluated. Even for the most demanding workload modeled, Dell deskside solutions remain highly competitive.
Where absolute savings are largest
Of the three workloads, this is where the 4x PowerEdge XE9780 cluster's raw dollar savings peak. With 32x NVIDIA B300 Blackwell Ultra GPUs, it is estimated at $2.3M annually, compared to $7.2M on AWS Bedrock and $36.7M through leading frontier APIs, representing two-year savings of $9.7M and $68.8M, respectively. Deskside solutions deliver meaningful savings as well: the Dell Pro Precision Series 9 T6 saves an estimated $431K over two years against AWS Bedrock.
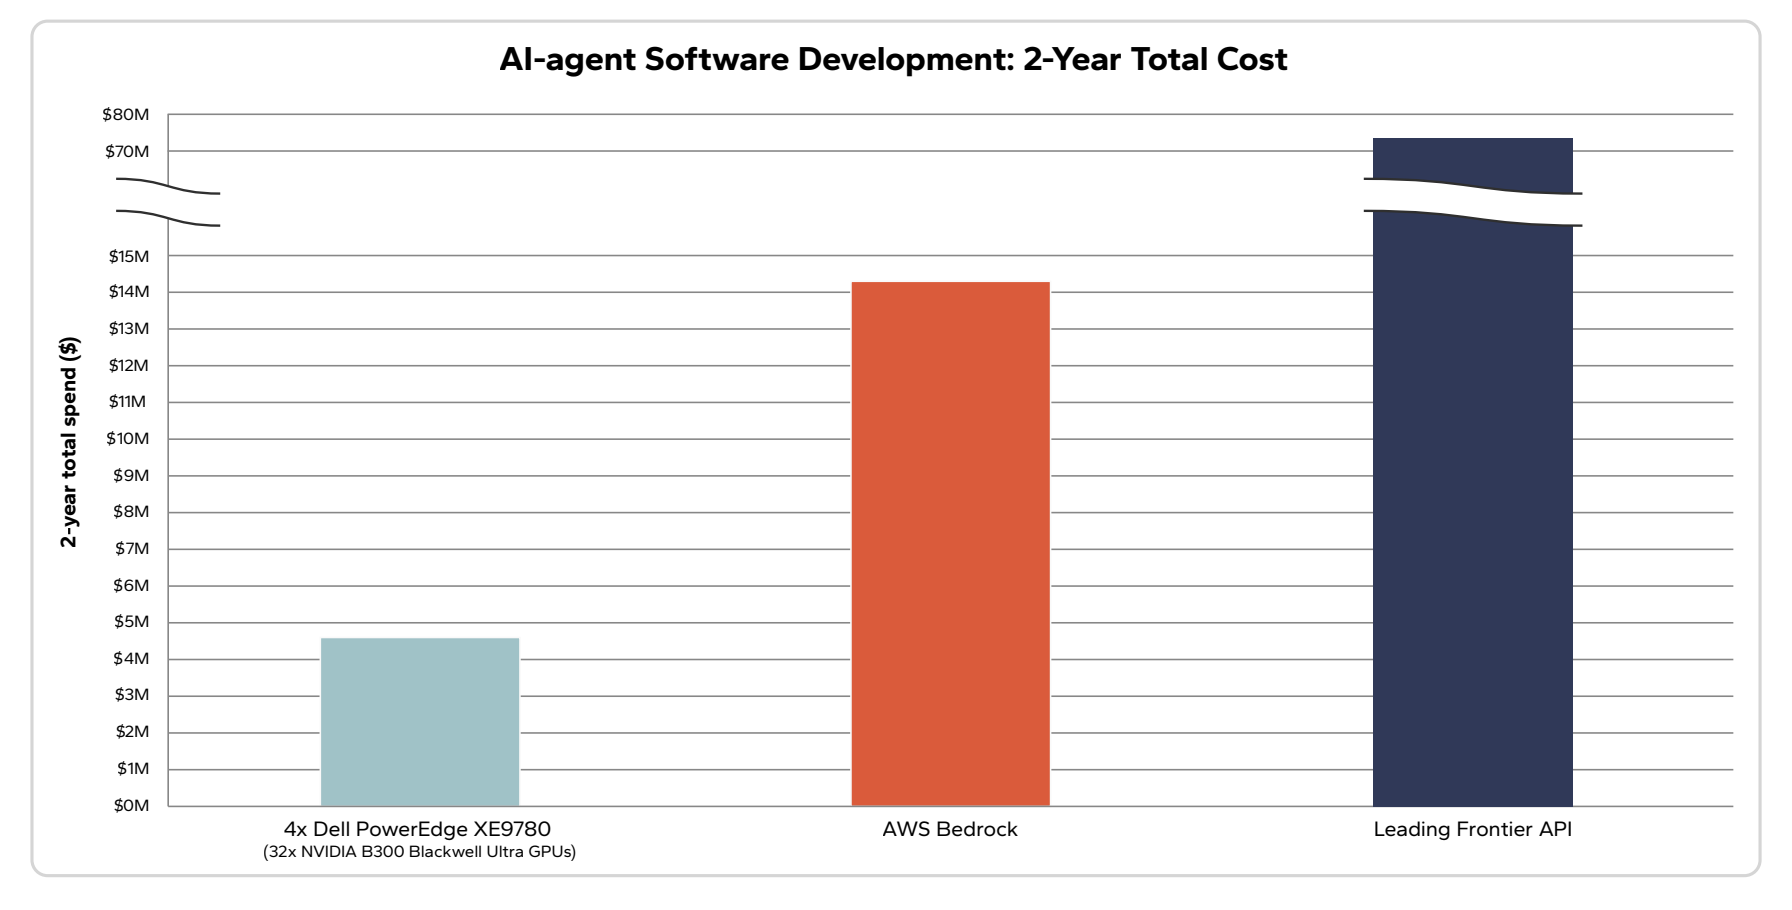
Figure 12: Total Two Year Cost (AI-Agent Software Development)
At full cluster scale, the 4x PowerEdge XE9780 running the Software Development workload saves an estimated $9.7M over two years against AWS Bedrock and $68.8M against the leading frontier API.
Portfolio Scaling: Deskside to Datacenter
The complete set of configurations evaluated demonstrate a wide range of scalability. For each workload, Dell AI Factory with NVIDIA solutions evaluated demonstrate an ability to support small agentic deployments up to large, enterprise scale fleets. Most notably, the cost per agent stays competitive across the entire range.
- AI-Agent Assisted Knowledge Worker: Scales from 26 to 33,821 agents
- AI-Enabled Sales Agent: Scales from 97 to 8,675 agents
- AI-Agent Software Development: Scales from 2 to 4,850 agents
The absolute savings scale with the deployment. At the entry point, a Dell Pro Precision with GB10 supporting 26 knowledge worker agents saves an estimated $8K over two years against AWS Bedrock and $85K against leading frontier API pricing. At the top of the portfolio evaluated, a 4x PowerEdge XE9780 (32x NVIDIA B300 Blackwell Ultra GPUs) cluster supporting 16,156 agents of the same type saves an estimated $4.2M and $51.8M respectively. The ratio of advantage stays broadly consistent across that range; what changes is the scale of the dollars involved.
Two solutions, the Dell Pro Precision Series 9 T4 and T6, were tested in two configurations:
- Single-instance: one instance of the model is spread across all of a system's GPUs, optimizing per-agent performance
- Multi-instance: multiple smaller instances run concurrently on the same hardware, maximizing the total number of agents the system can support
Multi-instance configurations deliver the highest agentic capacity per system and are therefore used as the default metrics throughout this paper. However, single-instance results reveal an important flexibility: organizations can start with fewer, higher-performing agents and scale up without changing hardware.
The T6 illustrates this clearly: In single-instance mode, it supported 223 Knowledge Worker agents at a 35% cost advantage, or 35 Software Development agents at 24%. Reconfiguring the same hardware to run multiple concurrent instances increased both figures substantially: the Knowledge Worker population grew 2.5x to 560 agents at a 74% cost advantage, while the Software Development population nearly quintupled to 172 agents at an 84% cost advantage.
The T4 showed the same pattern at a smaller scale: supporting 60% to 92% more agents in multi-instance mode than single-instance, depending on the workload.
This kind of built-in scaling – more agents from the same hardware, with no additional capital investment – demonstrates how organizations can begin with a focused agentic deployment and grow into full capacity over time, all while maintaining cost advantages over cloud alternatives.
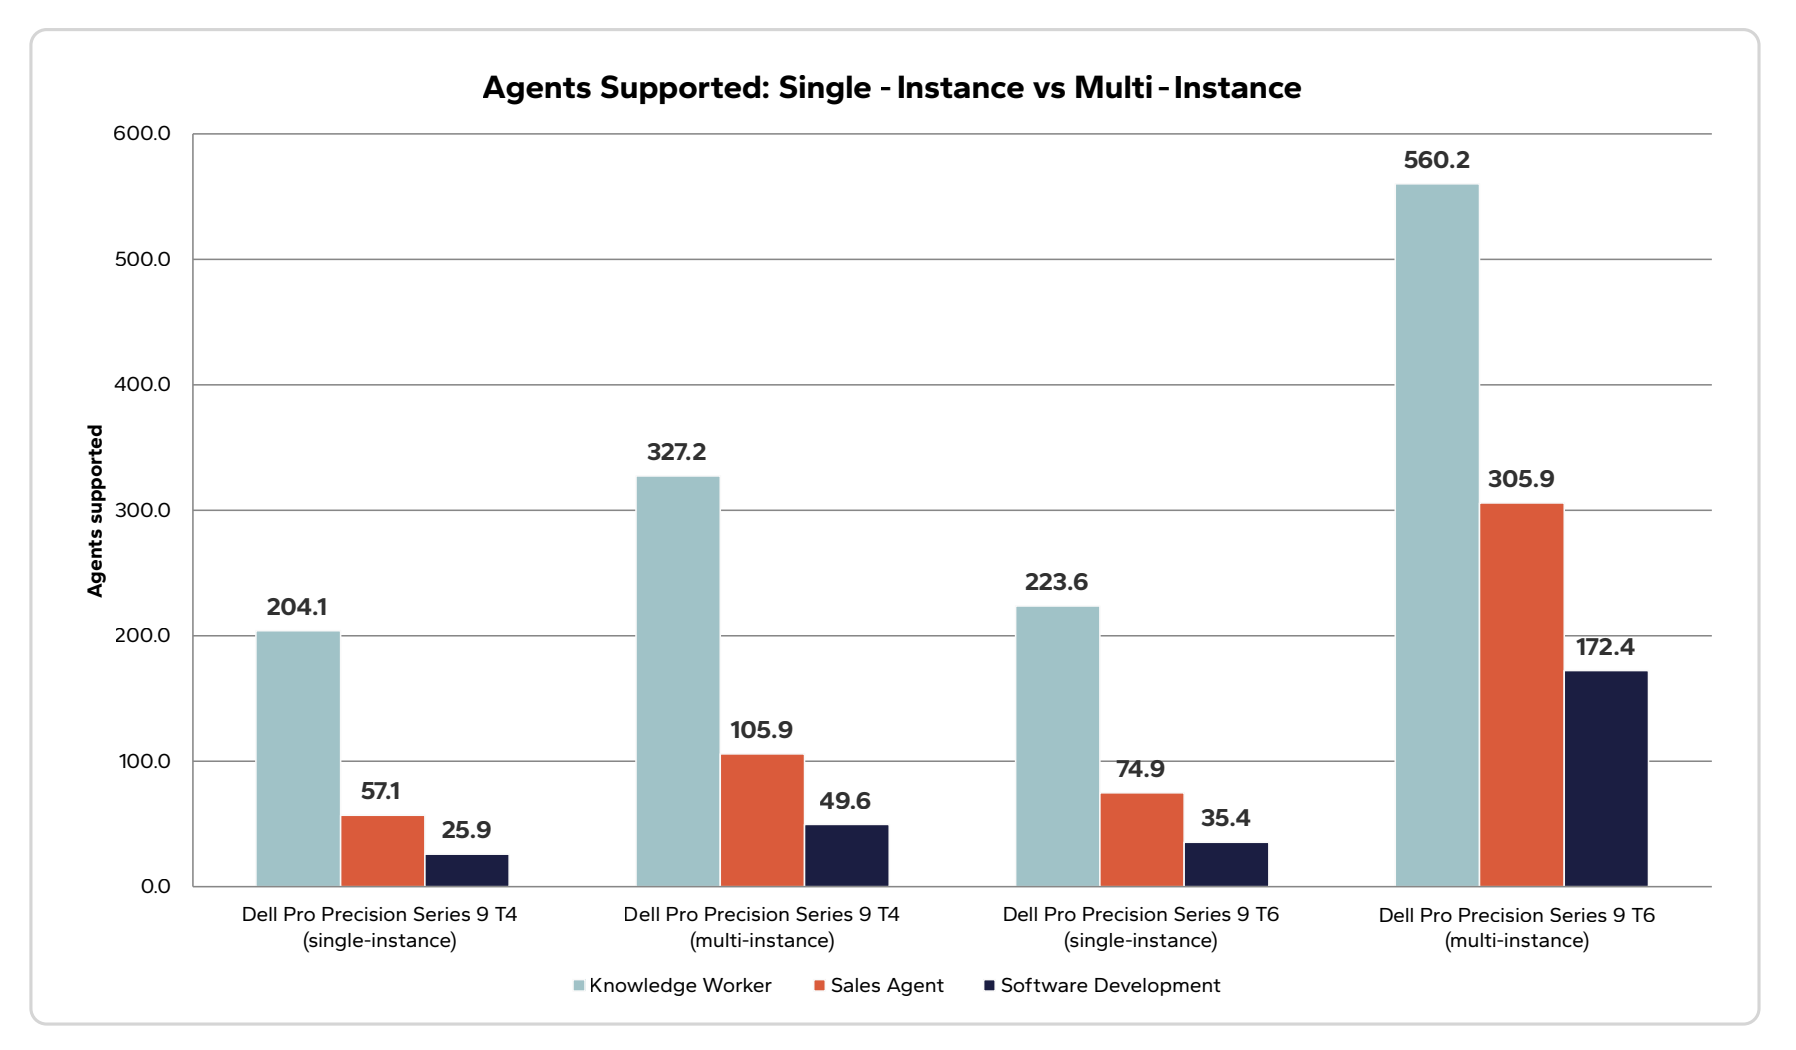
Figure 13: Single and Multi-Instance Deployment
Across the Dell Pro Precision Series 9 T4 and T6 systems, running multi-instance configurations instead of single-instance substantially increases the number of agents supported — for example, the T6 grows from 223 to 560 agents on the Knowledge Worker workload, and from 35 to 172 agents on the more demanding Software Development workload.
Running multiple concurrent instances also delivers operational benefits beyond cost and throughput, though these were not directly quantified in this study. Requests spread across several smaller instances face lower queuing latency than a single large instance handling the same load, since no request waits behind an entire shared queue. Faults are also isolated — if one instance encounters an error, only its share of capacity is affected rather than the full deployment. Multi-instance configurations support workload separation, allowing different task types to be routed to different instances, and each instance can be tuned independently, with its own batch size, context length, or quantization settings matched to its specific workload.
Cloud and API providers scale differently. Adding capacity on AWS Bedrock or a leading frontier API requires no reconfiguration at all — usage grows and cost scales continuously with it, with no upfront commitment. Dell's multi-instance approach scales in discrete steps instead: reconfiguring existing hardware, or adding another unit, unlocks a new tier of capacity. The tradeoff, however, is what has been quantified throughout this report: cloud's continuous elasticity comes at a materially higher cost per agent, while Dell's step-function scaling delivers a lower cost basis at every tier evaluated.
Scaling efficiency was also found at scale in the datacenter portfolio. Cost efficiency grows as you move up the NVIDIA GPU stack: from the NVIDIA RTX PRO 4500 Blackwell Server Edition, to the NVIDIA RTX PRO 6000 Blackwell Server Edition, to the NVIDIA H200 NVL, to the NVIDIA B300 Blackwell Ultra, per-GPU throughput rises from roughly 350, to 780, to 1,000, to 1,500 tokens/sec, with proportional gains in throughput per kilowatt.
Clustering additional server nodes compounds this further, adding both scale and cost efficiency at the same time. A 4-node NVIDIA RTX PRO 6000 Blackwell Server Edition deployment supports 8,455 agents; scaling to 16 nodes extends that to 33,821 agents while also lowering cost per agent.
Signal65 Comment: Dell additionally has NVIDIA endorsed AI Factory designs for RTX PRO 6000 up to 32 nodes, and HGX B300 up to 128 nodes that can further extend the cost efficiency of AI Factory clusters.
The overall range and scale demonstrated by the Dell AI Factory with NVIDIA portfolio presents a solution well equipped to support virtually all agentic AI needs. Deskside solutions are well equipped for small and mediumsized deployments as well as experimentation and prototyping, while the larger PowerEdge servers and multiserver clusters support pilots, large-scale production workloads, and large fleets of thousands of agents. Crucially, the entire portfolio demonstrates an ability to support agentic workloads of varying complexity, up to running software development workloads on a Dell Pro Precision with GB10. For organizations deploying agentic solutions, the Dell AI Factory with NVIDIA portfolio presents distinct entry points for every need, with consistent economic advantages.
Payback and Return on Investment
A key consideration for organizations selecting between on-premises and cloud infrastructure is how long a capex investment takes to break even against ongoing cloud costs. When considering AI infrastructure, the capex investment is often significant, making it crucial to understand if and when a system will break even. Once cumulative cloud costs surpass the initial hardware investment, on-premises infrastructure delivers a compounding economic advantage for as long as the workload continues to run, whether that is the 2 year period discussed in this paper, or longer.
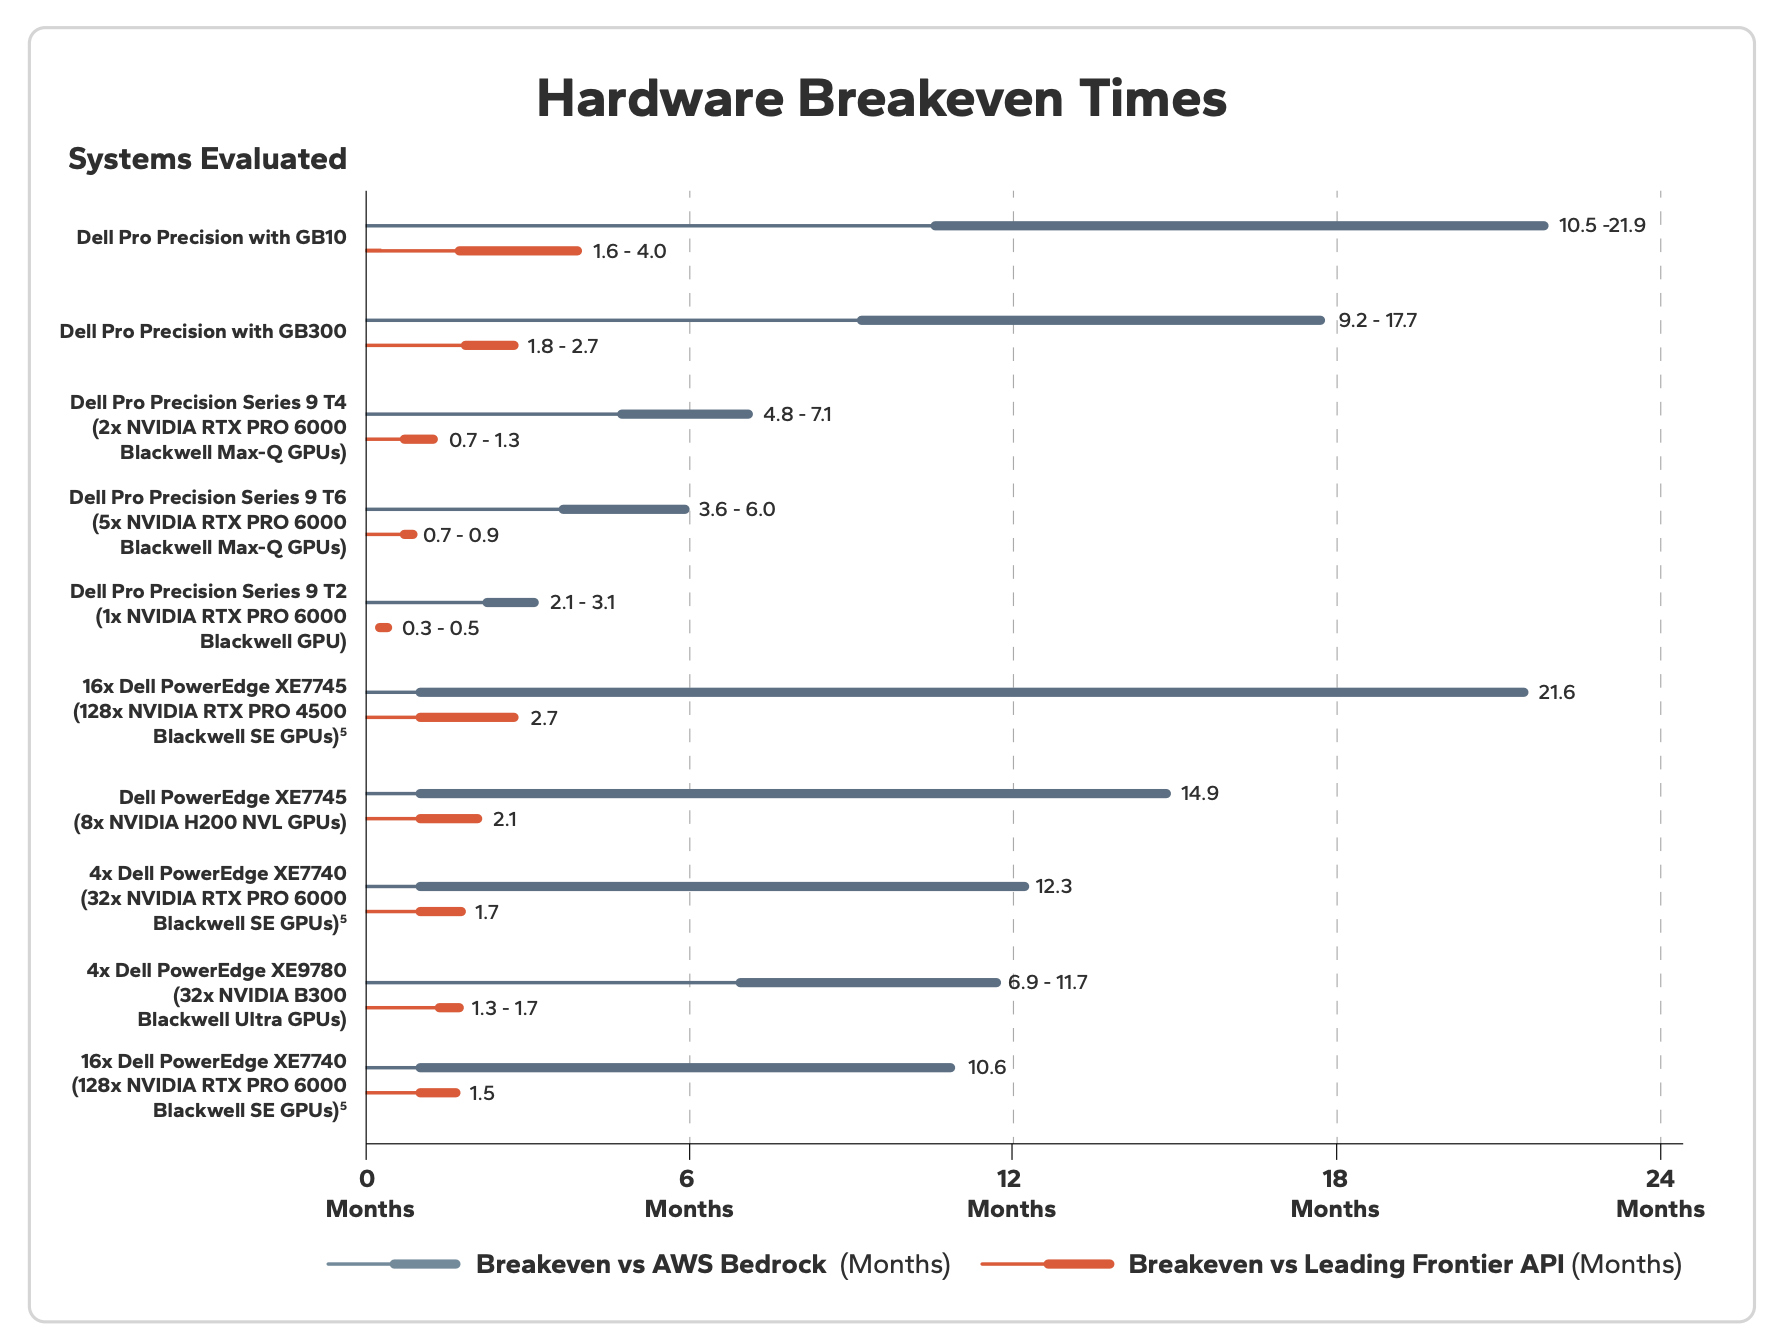
5Knowledge Worker only; NVIDIA Nemotron 3 Super was not benchmarked on this platform.
Figure 14: Hardware Breakeven Times
Every configuration evaluated reaches breakeven quickly against both comparators. Most systems break even within a year against Bedrock and within 3 months against the frontier API.
This study compared agentic workloads running on Dell hardware against two cloud comparators and found under two-year payback across all configurations evaluated. Against the leading frontier API provider, most configurations break even within 3 months, with the slowest payback at 4.0 months. Against AWS Bedrock, most configurations break even within a year. The fastest payback recorded was the Dell Pro Precision Series 9 T2 running the Knowledge Worker workload, breaking even in 2.1 months against Bedrock and under 1 month against the leading frontier API provider.
Signal65 Comment: Notably, the server configurations evaluated in this analysis are relatively small deployments. This is representative of the base scale and savings of the Dell AI Factory with NVIDIA datacenter portfolio and represents an entry point into these systems. In practice, these datacenter solutions can scale out further, offering an even lower cost per unit and furthering both the total savings and breakeven times found in this study.
Conclusion
As AI workloads continually shift towards autonomous agents, the core equation behind AI infrastructure selection fundamentally changes. Agents tolerate higher latency while consuming far more tokens. Relaxed latency requirements enable on-premises platforms to support more agents than interactive users, while increased token rates raise the total cost of cloud-based solutions. The combination of these factors creates a compelling economic argument for running agentic AI solutions on-premises.
The Dell AI Factory with NVIDIA presents a portfolio of solutions capable of supporting various agentic workloads from the desk to datacenter. This analysis found that the Dell AI Factory with NVIDIA portfolio can scale from 2 to more than 30,000 agents on a combination of a single device through 16-node server deployments, with cost advantages across all configurations evaluated. These advantages were found across three distinct workload profiles – an AI-Agent Assisted Knowledge Worker, AI-Enabled Sales Agent, and AI-Agent Software Development – showcasing how each platform can support models and workloads of varying complexity. The scale of the portfolio supports organizations at various points in their AI deployments, from small-scale prototyping to edge deployments to full production agentic fleets.
Futurum Research finds that direct financial impact, rather than productivity alone, has become the leading metric enterprises use to justify AI investment
Appendix
A. Full Assumptions and Pricing
Agent Workload Definitions
The workloads modeled in this study are based on three agent workloads that represent varying levels of complexity. Workloads were modeled based on common AI use cases and the approximate tokens required.
| Workload | Input Tokens / Agent/Day | Output Tokens / Agent/Day | Total Tokens / Agent/Day |
|---|---|---|---|
| AI-Agent Assisted Knowledge Worker | ~13.1M | ~205K | ~13.3M |
| AI-Enabled Sales Agent | ~16M | ~250K | ~16.3M |
| AI-Agent Software Development | ~21M | ~330K | ~21.3M |
The AI-Agent Assisted Knowledge Worker represents a low complexity agent, primarily completing low and moderate complexity tasks, such as email writing or text summarization. This agent has the lowest overall token utilization and can leverage small models.
AI-Agent Assisted Knowledge Worker (Low Complexity) — ~13.3M Total Tokens/Agent/Day
| Use Case | Description | Complexity |
|---|---|---|
| Simple Q&A | Basic questions, quick facts | Low |
| Learning / Tutoring | Explanations, examples, Q&A sessions | Low |
| Email Writing | Draft emails, responses | Low |
| Meeting Transcription Summary | Converting hour-long meetings to summaries | Low |
| Text Summarization | Summarizing documents, articles | Low |
| Document Editing | Revising large documents | Low |
| Research Assistant | Detailed explanations, research synthesis | Moderate |
| Complex Problem Solving | Multi-step reasoning, planning | Moderate |
| Data Analysis | Processing CSV / datasets, generating insights | Moderate |
| Content Creation | Blog posts, marketing copy, creative writing | Moderate |
The AI-Enabled Sales Agent represents a medium complexity agent, with its workload mix split between high and medium complexity tasks. In total, the AI-Enabled Sales Agent is comprised of 50% moderate complexity tasks and 50% high complexity tasks, and utilizes ~16.3M tokens/agent/day.
AI-Enabled Sales Agent (Medium Complexity) — ~16.3M Total Tokens/Agent/Day
| Use Case | Description | Complexity |
|---|---|---|
| Lead Qualification | Scoring and prioritizing inbound leads | Moderate |
| CRM Data Entry | Updating contact records, logging interactions | Moderate |
| Meeting Scheduling | Coordinating calendars, sending invites | Moderate |
| Email Outreach | Drafting initial prospecting emails | Moderate |
| Follow-Up Drafting | Personalized follow-up messages | Moderate |
| Proposal Generation | Custom pricing and scope proposals | High |
| Objection Handling | Real-time responses to prospect concerns | High |
| Competitive Analysis | Comparing offerings against competitors | High |
| Deal Forecasting | Multi-variable pipeline and revenue prediction | High |
| Contract Negotiation Support | Redlining terms, escalation judgment | High |
The AI-Agent Software Development workload represents a highly complex agent, with tasks such as code generation and API integration. This agent requires the highest overall token utilization and utilizes large models.
AI-Agent Software Development (High Complexity) — ~21.3M Total Tokens/Agent/Da
| Use Case | Description | Complexity |
|---|---|---|
| Documentation Writing | API docs, technical writing | Moderate |
| Technical Research | Looking up patterns, comparing approaches | Moderate |
| Code Completion | Inline IDE completions | High |
| Code Generation | Generating new functions / components | High |
| API Integration | Connect services, implement endpoints | High |
| Code Review | Reviewing code, suggestions | High |
| Bug Troubleshooting | Debugging, error analysis | High |
| Testing Assistance | Unit tests, test planning | High |
| SQL Query Generation | Writing / explaining SQL | High |
| Code Refactoring | Restructuring existing code | High |
Sizing and Workload Assumptions
Latency threshold: 10 tokens/sec per agent, representing the relaxed latency conditions of background agentic work.
Utilization: 80% across all three workloads. Higher utilization would result in increased token usage and further improve the advantages found in this report.
Token ratio: 64:1 input to output, approximated in benchmarking at 6,400 input / 100 output tokens.
Operating calendar: 260 days/year for the AI-Agent Assisted Knowledge Worker and AI-Enabled Sales Agent; 350 days/year for AI-Agent Software Development, which does not require a human counterpart present.
Hardware amortization: straight-line over two years.
Dell Hardware Pricing
| System | Two-Year Total |
|---|---|
| Dell Pro Precision with GB10 | $6,530 |
| Dell Pro Precision Series 9 T2 (1x NVIDIA RTX PRO 6000 Blackwell Workstation Edition GPU) | $16,840 |
| Dell Pro Precision Series 9 T4 (2x NVIDIA RTX PRO 6000 Blackwell Max-Q Workstation Edition GPUs) | $39,545 |
| Dell Pro Precision Series 9 T6 (5x NVIDIA RTX PRO 6000 Blackwell Max-Q Workstation Edition GPUs) | $79,545 |
| Dell Pro Precision with GB300 | $153,030 |
| Dell PowerEdge XE7745 (8x NVIDIA H200 NVL) | $973,872 |
| 4x Dell PowerEdge XE7740 (32x NVIDIA RTX PRO 6000 Blackwell Server Edition GPUs) | $2,617,634 |
| 4x Dell PowerEdge XE9780 (32x NVIDIA B300 Blackwell Ultra GPUs) | $4,634,905 |
| 16x Dell PowerEdge XE7745 (128x NVIDIA RTX PRO 4500 Blackwell Server Edition GPUs) | $7,605,586 |
| 16x Dell PowerEdge XE7740 (128x NVIDIA RTX PRO 6000 Blackwell Server Edition GPUs) | $9,246,311 |
Deskside costs reflect hardware pricing and annual operating energy costs. Datacenter costs reflect hardware, software, and services pricing, as well as energy, colocation, and maintenance. Pricing was benchmarked between July and September 2026 and is subject to change. Individual pricing may vary. Two-year total reflects the amortization period used throughout this report. Deskside and datacenter solutions are expected to have useful life beyond the two-year period but were not modeled for this paper.
Benchmark Results (6,400 input / 100 output tokens)
| System | Model | Concurrency | Tokens/sec per Agent | Aggregate Tokens/sec |
|---|---|---|---|---|
| Dell Pro Precision with GB10 | NVIDIA Nemotron 3 Nano | 8 | 24.9 | 77.7 |
| Dell Pro Precision with GB10 | NVIDIA Nemotron 3 Super | 2 | 12.9 | 11.4 |
| Dell Pro Precision Series 9 T2 (1x NVIDIA RTX PRO 6000 Blackwell Workstation Edition GPU) | NVIDIA Nemotron 3 Nano | 256 | 10.5 | 897.0 |
| Dell Pro Precision Series 9 T2 (1x NVIDIA RTX PRO 6000 Blackwell Workstation Edition GPU) | NVIDIA Nemotron 3 Super | 16 | 29.9 | 217.4 |
| Dell Pro Precision Series 9 T4 (2x NVIDIA RTX PRO 6000 Blackwell Max-Q Workstation Edition GPUs) | NVIDIA Nemotron 3 Nano | 128 | 18.0 | 971.3 |
| Dell Pro Precision Series 9 T4 (2x NVIDIA RTX PRO 6000 Blackwell Max-Q Workstation Edition GPUs) | NVIDIA Nemotron 3 Super | 32 | 12.7 | 237.2 |
| Dell Pro Precision Series 9 T6 (5x NVIDIA RTX PRO 6000 Blackwell Max-Q Workstation Edition GPUs) | NVIDIA Nemotron 3 Nano | 512 | 15.0 | 1,663.2 |
| Dell Pro Precision Series 9 T6 (5x NVIDIA RTX PRO 6000 Blackwell Max-Q Workstation Edition GPUs) | NVIDIA Nemotron 3 Super | 256 | 17.3 | 823.8 |
| Dell Pro Precision with GB300 | NVIDIA Nemotron 3 Nano | 512 | 13.2 | 1,127.3 |
| Dell Pro Precision with GB300 | NVIDIA Nemotron 3 Super | 512 | 17.0 | 632.8 |
| PowerEdge XE7745 (8x H200 NVL GPUs) | NVIDIA Nemotron 3 Nano | 1000 | 11.3 | 8,026.7 |
| PowerEdge XE9780 (8x B300 Blackwell Ultra GPUs, per node) | NVIDIA Nemotron 3 Nano | 1000 | 20.3 | 11,991.0 |
| PowerEdge XE9780 (8x B300 Blackwell Ultra GPUs, per node) | NVIDIA Nemotron 3 Super | 500 | 14.8 | 5,792.8 |
| PowerEdge XE7740 (8x RTX PRO 6000 Blackwell Server Edition GPUs, per node) | NVIDIA Nemotron 3 Nano | 500 | 15.8 | 6,275.4 |
| PowerEdge XE7745 (8x RTX PRO 4500 Blackwell Server Edition GPUs, per node) | NVIDIA Nemotron 3 Nano | 8000 | 11.5 | 2,811.3 |
Each row reports the operating point that delivers the highest aggregate throughput while the average per-request generation rate stays at or above 10 tokens/sec. Server results were measured on single 8-GPU nodes; cluster figures throughout this report scale these values linearly by node count. Concurrency refers to the concurrent request load exercised in the benchmark; the reported agent numbers are derived from the resulting aggregate token throughput, not from the concurrency value itself.
Provider Adjustments
| Provider | Overhead | Discount |
|---|---|---|
| AWS Bedrock | 45% | -20% |
| Leading Frontier API | 0% | -40% |
Cache hit rate: 25%, applied to every provider publishing a cached-input tier.
AWS Bedrock overhead (net +25%): covers the broader cloud operating stack required alongside model inference — Bedrock Guardrails, vector database and RAG indexing, observability and runtime tooling, application-layer retry and connection infrastructure, and associated SRE and security operations effort. This is a net figure, reflecting an estimated gross overhead of roughly 45% against an assumed 20% enterprise discount on Bedrock model token spend. Individual pricing may vary. Data egress was estimated to be negligible for text inference at these volumes. Dell datacenter configurations include NVIDIA AI Enterprise, deployment, integration, and credit for potential first year services, as well as estimated maintenance, colocation hosting, and energy costs, which covers a comparable serving, guardrails and support stack; Dell deskside configurations are modeled as open-source software deployments and include estimated energy costs.
Leading frontier API discount (−40%): reflects estimated negotiated enterprise pricing at this scale. Individual pricing may vary. Bedrock includes the rough 20% enterprise discount mentioned above. Individual pricing will vary
B. Per-Configuration Detail
The tables below reproduce the full result set for each workload, including the single-instance Dell Pro Precision Series 9 T4 and T6 configurations that are summarized but not tabulated in the main body. Values are per agent per year unless otherwise noted.
AI-Agent Assisted Knowledge Worker
| System Evaluated | Agents | vs AWS Bedrock | Break Even vs Bedrock (Month) | vs Leading Frontier API | Break Even vs Leading Frontier (Month) |
|---|---|---|---|---|---|
| 4x PowerEdge XE9780 (32x B300 Blackwell Ultra GPUs) | 16,156.3 | Dell 47% Lower Cost | 11.7 | Dell 92% Lower Cost | 1.7 |
| PowerEdge XE7745 (8x H200 NVL GPUs) | 2,703.7 | Dell 34% Lower Cost | 14.9 | Dell 90% Lower Cost | 2.1 |
| 4x PowerEdge XE7740 (32x RTX PRO 6000 Blackwell Server Edition GPUs) | 8,455 | Dell 43% Lower Cost | 12.3 | Dell 91% Lower Cost | 1.7 |
| 16x PowerEdge XE7740 (128x RTX PRO 6000 Blackwell Server Edition GPUs) | 33,821 | Dell 50% Lower Cost | 10.6 | Dell 92% Lower Cost | 1.5 |
| 16x PowerEdge XE7745 (128x RTX PRO 4500 Blackwell Server Edition GPUs) | 15,151 | Dell 8% Lower Cost | 21.6 | Dell 86% Lower Cost | 2.7 |
| Dell Pro Precision Series 9 T6 (5x NVIDIA RTX PRO 6000 Blackwell Max-Q Workstation Edition GPUs) | 560.2 | Dell 74% Lower Cost | 6.0 | Dell 96% Lower Cost | 0.9 |
| Dell Pro Precision with GB300 | 379.7 | Dell 26% Lower Cost | 17.7 | Dell 88% Lower Cost | 2.7 |
| Dell Pro Precision Series 9 T4 (2x NVIDIA RTX PRO 6000 Blackwell Max-Q Workstation Edition GPU) | 327.2 | Dell 78% Lower Cost | 4.8 | Dell 97% Lower Cost | 0.7 |
| Dell Pro Precision Series 9 T2 (1x NVIDIA RTX PRO 6000 Blackwell Workstation Edition GPU) | 302.2 | Dell 90% Lower Cost | 2.1 | Dell 98% Lower Cost | 0.3 |
| Dell Pro Precision Series 9 T6 (single-instance) | 223.6 | Dell 35% Lower Cost | 15.4 | Dell 90% Lower Cost | 2.3 |
| Dell Pro Precision Series 9 T4 (single-instance) | 204.1 | Dell 64% Lower Cost | 7.9 | Dell 94% Lower Cost | 1.2 |
| Dell Pro Precision with GB10 | 26.2 | Dell 54% Lower Cost | 10.5 | Dell 93% Lower Cost | 1.6 |
AI-Enabled Sales Agent
| System Evaluated | Agents | vs AWS Bedrock | Break Even vs Bedrock (Month) | vs Leading Frontier API | Break Even vs Leading Frontier (Month) |
|---|---|---|---|---|---|
| 4x PowerEdge XE9780 (32x B300 Blackwell Ultra GPUs) | 8,676.0 | Dell 54% Lower Cost | 10.1 | Dell 92% Lower Cost | 1.7 |
| Dell Pro Precision Series 9 T6 (5x NVIDIA RTX PRO 6000 Blackwell Max-Q Workstation Edition GPUs) | 305.9 | Dell 78% Lower Cost | 5.1 | Dell 96% Lower Cost | 0.9 |
| Dell Pro Precision with GB300 | 225.1 | Dell 41% Lower Cost | 14.0 | Dell 89% Lower Cost | 2.5 |
| Dell Pro Precision Series 9 T4 (2x NVIDIA RTX PRO 6000 Blackwell Max-Q Workstation Edition GPUs) | 105.9 | Dell 68% Lower Cost | 7.1 | Dell 94% Lower Cost | 1.3 |
| Dell Pro Precision Series 9 T2 (1x NVIDIA RTX PRO 6000 Blackwell Workstation Edition GPU) | 97.2 | Dell 85% Lower Cost | 3.1 | Dell 97% Lower Cost | 0.5 |
| Dell Pro Precision Series 9 T6 (single-instance) | 74.9 | Dell 8% Lower Cost | 21.9 | Dell 83% Lower Cost | 3.8 |
| Dell Pro Precision Series 9 T4 (single-instance) | 57.1 | Dell 40% Lower Cost | 13.6 | Dell 89% Lower Cost | 2.3 |
AI-Agent Software Development
| System Evaluated | Agents | vs AWS Bedrock | Break Even vs Bedrock (Month) | vs Leading Frontier API | Break Even vs Leading Frontier (Month) |
|---|---|---|---|---|---|
| 4x PowerEdge XE9780 (32x B300 Blackwell Ultra GPUs) | 4,850.4 | Dell 68% Lower Cost | 6.9 | Dell 94% Lower Cost | 1.3 |
| Dell Pro Precision Series 9 T6 (5x NVIDIA RTX PRO 6000 Blackwell Max-Q Workstation Edition GPUs) | 172.4 | Dell 84% Lower Cost | 3.6 | Dell 97% Lower Cost | 0.7 |
| Dell Pro Precision with GB300 | 132.5 | Dell 61% Lower Cost | 9.2 | Dell 92% Lower Cost | 1.8 |
| Dell Pro Precision Series 9 T4 (2x NVIDIA RTX PRO 6000 Blackwell Max-Q Workstation Edition GPUs) | 49.6 | Dell 73% Lower Cost | 5.9 | Dell 95% Lower Cost | 1.1 |
| Dell Pro Precision Series 9 T2 (1x NVIDIA RTX PRO 6000 Blackwell Workstation Edition GPUs) | 45.5 | Dell 88% Lower Cost | 2.5 | Dell 98% Lower Cost | 0.5 |
| Dell Pro Precision Series 9 T6 (single-instance) | 35.4 | Dell 24% Lower Cost | 17.9 | Dell 85% Lower Cost | 3.4 |
| Dell Pro Precision Series 9 T4 (single-instance) | 25.9 | Dell 48% Lower Cost | 11.6 | Dell 90% Lower Cost | 2.2 |
| Dell Pro Precision with GB10 | 2.4 | Dell 8% Lower Cost | 21.9 | Dell 82% Lower Cost | 4.0 |
C. Impact of Token Ratios, Utilization, and Operating Calendar
This analysis uses a baseline assumption of a 64:1 input to output token ratio. While this provides consistency across workloads for this analysis, in practice complex workloads may extend this ratio with even greater token input capacities, reflecting large context windows and other behind the scenes task orchestration. Workloads such as software development or other complex processes that utilize large models often reach 100:1 or more token ratios. While these ratios were not specifically modeled, the impact of growing token ratios is likely to further increase the advantages for on-premises hardware. For cloud models, the increase in input incurs additional per-token costs. Meanwhile, on-premises platforms support this increased token load at a set hardware cost. Because of this, Dell’s cost advantage for complex, input-heavy workloads may actually exceed what is found in this report.
Two other assumptions – hardware utilization and operating calendars – additionally impact the total number of tokens processed, and as a result the economic advantages. Hardware utilization was assumed to be 80% for all workloads modeled in this analysis. Higher utilization rates would further increase the advantages found in this report. Operating calendar assumptions varied based on workload, with the AI-Agent Assisted Knowledge Worker and AI-Enabled Sales Agent workloads operating for 260 days/year and the AI-Agent
Software Development workload operating for 350 days a year. The increase in operating days additionally increases the total tokens processed, increasing the advantages for on-premises workloads, as can be seen in the more autonomous AI-Agent Software Development workload. As agentic workloads continue to develop they will likely become more autonomous, increasing the number of operating days, further increasing on-premises economic advantages.
D. Limitations
The following limitations apply to the analysis presented in this report:
The 64:1 input:output token ratio is pinned to the largest ratio in the benchmarking matrix (6,400 / 100 tokens) that we tested.
Leading frontier cloud API tiers are matched on price positioning rather than benchmarked capability equivalence.
Working cost of capital, depreciation, and other accounting methodologies were not included in this analysis.
Pricing was noted as of July through September 2026.
Individual results and pricing may vary.
Authors
- Mitch Lewis: Performance Analyst | Signal65
- Ryan Shrout: President & GM | Signal65