- Best for advanced data visualization: Tableau
- Best for integration with Microsoft products: Microsoft Power BI
- Best for customizable data modeling: Looker Studio
- Best for user-friendly interface: Zoho Analytics
- Best for associative data modeling: QlikView
- best for real-time data visualization: Domo
- Best for a wide range of data visualization tools: Microsoft Excel
- Best for web-based data visualization: Google Charts
Data visualization tools have become essential in translating complex data into actionable insights. With the right tool, businesses and data professionals can uncover trends, patterns and insights that drive strategic decisions.
Tools like Microsoft Power BI, Excel, Google Charts and Looker Studio are more ideal for businesses with existing Microsoft or Google ecosystems. Tableau, Zoho Analytics, QlikView, and Domo offer advanced analytics, more robust data integration and greater customization options, making them suitable for businesses requiring in-depth data analysis and flexible visualization capabilities.
Regardless, choosing the right data visualization tool comes down to the data analysis needs of the business, the level of customization required and the compatibility with existing data systems.
Best data visualization tools: Comparison table
| Software | Real-Time Data Processing | Ease of Use | Cloud-Based | AI Capabilities | Mobile access | Starting price |
|---|---|---|---|---|---|---|
| Tableau | Yes | Moderate | Yes | Yes | Yes | $15 per user per month |
| Microsoft Power BI | Yes | High | Yes | Yes | Yes | $10 per user per month |
| Looker Studio | Yes | Moderate | Yes | Yes | Yes | Free |
| Zoho Analytics | Yes | High | Yes | Yes | Yes | $22 per month |
| QlikView | Yes | Moderate | Yes | Yes | Yes | $20 per user per month |
| Domo | Yes | Moderate | Yes | Yes | Yes | $300 per month |
| Microsoft Excel | No | High | Partly (with Microsoft 365) | No | Yes | Part of Microsoft 365 subscription |
| Google Charts | No | High | Yes | No | Yes | Free |
Tableau: Best for advanced data visualization

Tableau, a product of Salesforce, is one of the most popular and most often used data visualization application suites on the market. Its popularity comes from its advanced analytics capabilities and interactive dashboards and reports, which large enterprises and professional analysts surely appreciate.
Pricing
Tableau offers a 7-day free trial for each of its three paid plans:
- Viewer: $15 per user per month, billed annually.
- Explorer: $42 per user per month, billed annually.
- Creator: $75 per user per month, billed annually.
Standout features
- Interactive dashboards for creating dynamic and engaging visualizations.
- Supports a wide range of data sources and integrations with advanced analytics tools.
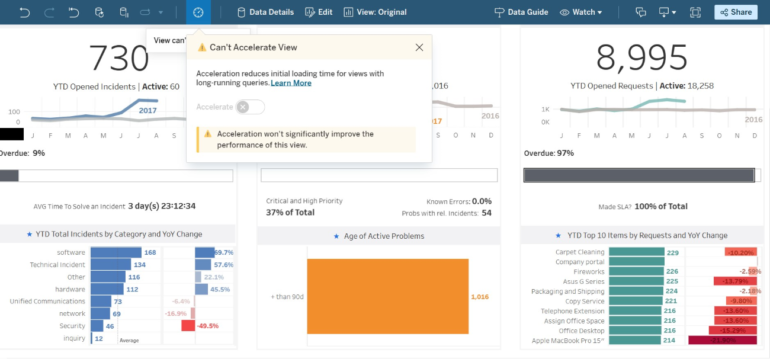
- Advanced visual analytics capabilities to handle complex data sets and provide deep insights (Figure A).
Pros
- Tableau is a user-friendly platform that’s accessible to users with different levels of expertise.
- It benefits from a large and active user community.
- Tableau has extensive customization options.
Cons
- Tableau can be expensive, especially for smaller organizations.
- Users may need time to master its full range of features.
- Tableau Mobile’s performance is inconsistent on Android.
Why we picked Tableau
We chose Tableau because of its impressive interactive data visualization capabilities and robust analytics. Beyond visualizations, it offers effective AI capabilities that help to streamline and ease analytics tasks and has great community support and extensive support resources.
SEE: For more information, read the full Tableau review and our Tableau cheat sheet.
Microsoft Power BI: Best for integration with Microsoft products

Microsoft Power BI is a full-service business intelligence suite of data visualization applications. It offers deep integration with Microsoft products, making it popular among teams of all sizes, especially those using the Microsoft ecosystem. Power BI can pull in data from many different sources and coordinate dashboards and visual reports across teams, departments and enterprises.
Pricing
- Free: No cost.
- Power BI Pro: Available as a Microsoft 365 E3 add-on or at $10 per user per month.
- Power BI Premium: $20 per user per month. A 30-day free trial is available.
Standout features
- Seamless compatibility with Microsoft’s suite of products.
- Real-time dashboards for a 360-degree view of business data.
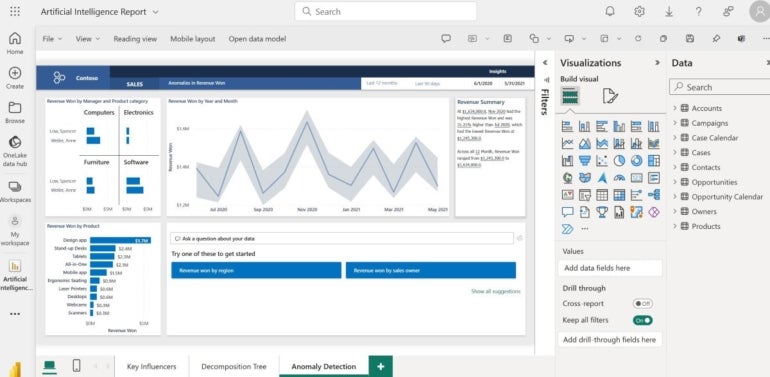
- Customizable visualizations (Figure B) with more than 30 visuals available.
Pros
- Robust customer support.
- More effective than its alternatives for users already in the Microsoft ecosystem.
- Intuitive and user-friendly, suitable for various skill levels.
Cons
- Understanding pricing can be frustrating.
- Power BI’s performance can fluctuate.
- Best utilized within the Microsoft environment.
Why we picked Microsoft Power BI
Microsoft Power BI makes it to our list primarily thanks to its excellent integration with Microsoft products. Its user interface is user-friendly, coupled with an affordable price, to make Power BI accessible to a wide range of users.
SEE: For more information, read the full Microsoft Power BI review.
Looker Studio: Best for customizable data modeling

Google Looker Studio is a cloud-based business intelligence and data analysis service with a data visualization component. It stands out for its customizable data modeling and integration with Google Cloud, which makes it a no-brainer for businesses already using other products in the Google ecosystem. Looker Studio concentrates its efforts on discovering hidden patterns and information within big data streams.
Pricing
Google Looker has a free version and three paid editions. The paid editions include Standard, Enterprise and Embed; get custom pricing by consulting their sales teams.
Standout features
- Customizable data modeling through LookML, its unique modeling language.
- Straightforward compatibility with Google Cloud services.
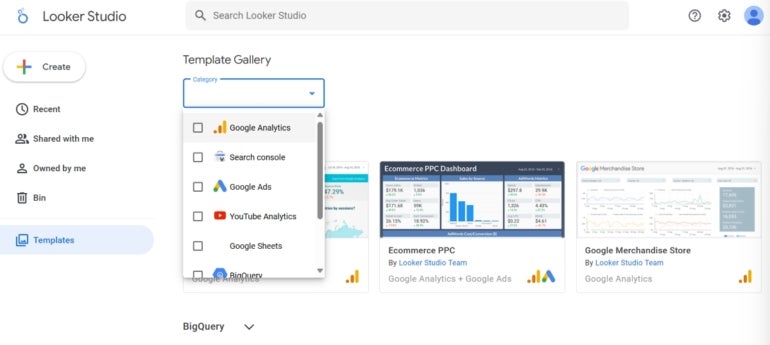
- Template gallery alongside advanced data visualization capabilities (Figure C).
Pros
- Great for Google’s product ecosystem.
- Shared dashboards strengthen its collaborative capabilities.
- Easy to pick up and use as it has a straightforward free version.
Cons
- Its advanced features can be underutilized by casual users.
- LookML can be rather challenging to grasp for beginners.
- Pricing for the paid tiers can be confusing.
Why we picked Looker Studio
Similar to Power BI, we selected Looker Studio due to its integration into Google’s Cloud Platform, offering a suite of interrelated tools that enhance data visualization capabilities. With Looker Studio, users can easily create real-time dashboards that make their data analysis more effective.
SEE: For more information, check out how Looker compares to Tableau.
Zoho Analytics: Best for user-friendly interface

Zoho Analytics is a cloud-based data visualization platform with business intelligence, AI and collaboration. Small and midsize businesses should consider Zoho Analytics should they want a user-friendly interface alongside AI-powered analytics. Additionally, the platform can access data from many different sources and outputs, including mobile, web-based or simple reports.
Pricing
Zoho offers a Free plan as well as 15-day free trial for each of its premium plans:
- Basic: $24 per month, billed annually, or $30 per month when billed monthly.
- Standard: $48per month, billed annually, or $60 per month when billed monthly.
- Premium: $115 per month, billed annually, or $145 per month when billed monthly.
- Enterprise: $455 per month, billed annually, or $575 per user month billed monthly.
Standout features
- AI assistant for advanced data analytics.
- Diverse visualization options, like a variety of charts, widgets and pivot tables.
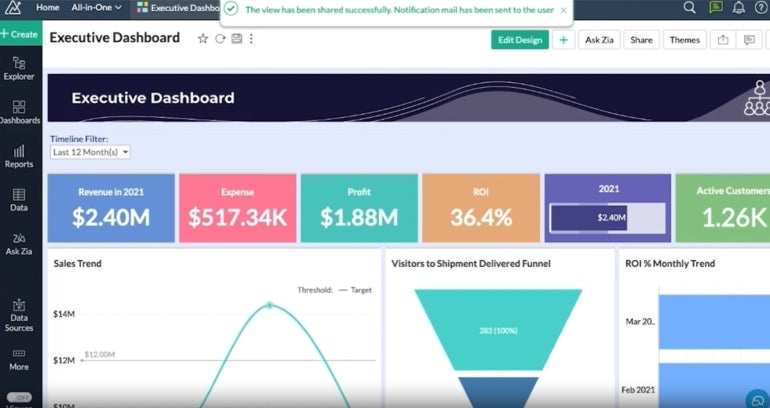
- Intuitive user interface with self-service features (Figure D).
Pros
- Competitive pricing makes it affordable for smaller businesses.
- Intuitive interface makes it easy to use for users without advanced technical skills.
- Robust mobile application.
Cons
- It doesn’t offer as much customizability as some of its alternatives.
- It’s not ideal for advanced advanced analytics needs.
- Maximum efficiency when used with other Zoho products.
Why we picked Zoho Analytics
Zoho Analytics is selected for its balance of a user-friendly interface and powerful AI-driven analytics, making it ideal for SMBs. Its straightforward ability to transform raw data from various sources into meaningful reports and visualizations allows a wider net of users to quickly develop and publish reports.
SEE: Explore our side-by-side comparison of Power BI and Zoho Analytics.
QlikView: Best for associative data modeling

QlikView is another cloud-based business intelligence platform designed to provide visual dashboards and reports using advanced AI and machine learning technologies. Its associative data modeling and interactive guided analytics are its standout features that meet the needs of businesses that require personalized, interactive data discovery. The service stresses enterprise-level collaboration features.
Pricing
Qlik has a trio of plans, namely the Standard, Premium and Enterprise, but pricing information can only be obtained by contacting Qlik and requesting a quote. When billed annually, the Standard and Premium plans cost $20 per user per month and $2700 per month.
Standout features
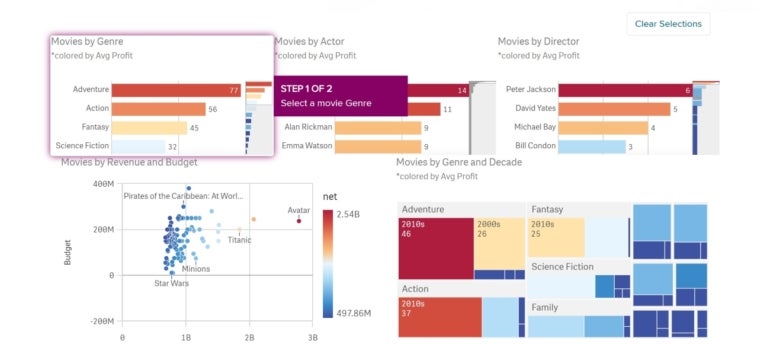
- Interactive guided analytics for deep diving into data with guided exploration.
- Enterprise-level real-time collaboration for active analytics across large teams and departments.
- Associative data modeling for a unique approach to data exploration and discovery (Figure E).
Pros
- Qlik tailors data exploration to individual user needs.
- It’s suitable for businesses of various sizes.
- Qlik offers AI-powered insights.
Cons
- Can be complex for new users to grasp fully.
- Cost may easily spiral for larger enterprise deployments.
- Its interface isn’t as intuitive as some of its competitors.
Why we picked QlikView
QlikView delivers fast data processing and interactive visualizations, making it one of the quickest data visualization tools on the market. Its associative data engine allows users to explore all their data from any angle within dashboards, which offers them clarity and understanding.
Domo: best for real-time data visualization

Domo is a cloud-based data visualization tool that can access data from many sources, including AWS, Google, Snowflake and other on-premises environments. The platform is known for its real-time data visualization capabilities, as the company markets itself as a low-code digital transformation platform for reports, dashboards and data analysis.
Pricing
Domo has a limited free plan that allows businesses to try out some of the features available in its three paid plans.
- Standard: Starts at $300 per month for 400 credits.
- Enterprise: Contact sales to request a quote.
- Business Critical: Contact sales to request a quote.
Standout features
- Low-code platform for easier creation of reports and dashboards.
- Integration with diverse data sources.
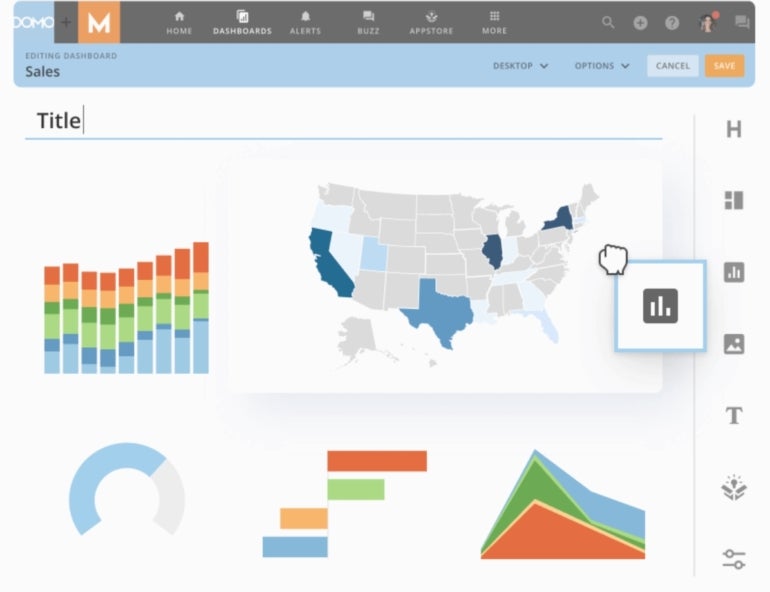
- Real-time data visualization for immediate insights into data changes and trends (Figure F).
Pros
- Domo is suitable for various business sizes and industries.
- It’s accessible to users with different levels of technical expertise.
- It’s a no-code platform.
Cons
- Some features may need technical expertise to use.
- Only one pricing plan is transparent upfront.
- Complexity in large deployments — can become complex to manage in larger setups.
Why we picked Domo
We listed Domo because of its real-time data visualization capabilities that turn data into vibrant, interactive dashboards. Domo also delivers an intuitive, low-code platform that makes it worth considering for immediate data analysis needs.
SEE: Check out our side-by-side comparison of Domo and Tableau.
Microsoft Excel: Best for a wide range of data visualization tools

Microsoft Excel, the spreadsheet application found in the Microsoft 365 suite of productivity apps, is often the first introduction to data visualization techniques and analysis for many users. Known for its wide range of data visualization tools and familiar interface, Excel is great for basic data analysis and visualization. Despite its general availability and ease of use, Excel can be a powerful data visualization tool.
Pricing
Excel is part of the Microsoft 365 subscription.
Standout features
- A familiar interface that makes it accessible to a broad audience.
- Integration with Microsoft 365.
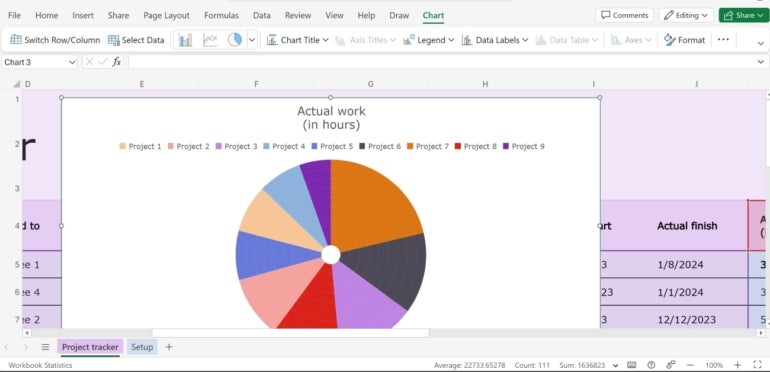
- Variety of visualization tools, with charts, graphs, pivot tables and more for data presentation (Figure G).
Pros
- Ubiquity and familiarity reduce the learning curve for data visualization.
- It’s suitable for a range of basic to moderately complex data tasks.
- It’s easy to pick up and use.
Cons
- Large datasets can impact performance
- It’s not as powerful as specialized data visualization software.
- Premium features require users to purchase a Microsoft 365 subscription.
Why we picked Microsoft Excel
Microsoft Excel earns a spot on our list because of its widespread use and familiarity, making it a great starting point and a go-to software for data visualization for businesses of all sizes, from basic to moderately complex data tasks. Plus, its integration within the Microsoft 365 suite makes it both versatile and reliable.
Google Charts: Best for web-based data visualization

Google Charts specializes in creating mobile and web-based reports, dashboards and other visual assets. It has a wide variety of chart types and integration with Google products, which makes it appealing for developers and businesses needing web-based visualizations. Primarily a tool designed for developers, Google Charts relies heavily on JavaScript.
Pricing
Google Charts is available for free.
Standout features
- Seamless integration with Google products.
- Web-based focus making it ideal for creating interactive online reports and dashboards.
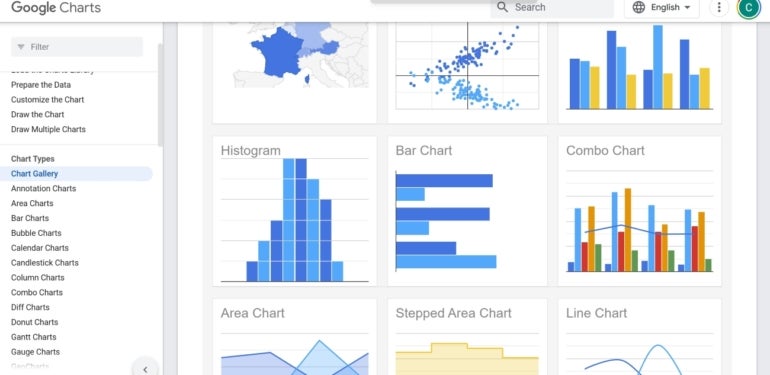
- Wide variety of chart types that deliver extensive data visualization options (Figure H).
Pros
- Free to use, making it accessible to a wide range of users.
- It’s developer-friendly as it offers them extensive customization options.
- Great tool for web-based applications.
Cons
- Advantageous to users with JavaScript knowledge.
- It’s primarily designed for online use.
- Users who aren’t developers may experience a learning curve when customizing the tool.
Why we picked Google Charts
Google Charts is part of our selection as it’s able to create a wide variety of charts and visualizations, especially suited for web-based applications. Its emphasis on JavaScript allows for extensive customization that enables users to create interactive and engaging online visualizations. It also integrates well with Google products, plus, it’s free!
How do I choose the best data visualization tool for my business?
Selecting the right data visualization tool isn’t just about its features; it’s about how those features align with business needs and goals. Businesses need to:
- Understand their data needs.
- Consider the technical expertise at their disposal.
- Keep integration with other systems in mind.
- Plan for scalability.
- Consider the cost of the data visualization tool.
Throughout this article, we’ve explored a variety of software options, each with its own use case.
ACADEMY: Learn how to visualize data like a pro.
For businesses searching for real-time data analysis and a low-code platform, Domo stands out as an excellent choice. Its ability to provide vibrant, interactive dashboards with real-time insights makes it ideal for dynamic business environments.
On the other hand, for businesses that operate heavily within the Google ecosystem and value the integration of cloud-based tools, Looker Studio emerges as a powerful option. Google Charts also falls into this category and is ideal for businesses focusing on online data visualization.
For those in need of a tool that offers a balance of user-friendliness, AI and collaboration capabilities, Zoho Analytics is a strong contender. Its collaborative features and diverse visualization options cater well to small and medium-sized businesses.
QlikView, with its fast data processing and interactive visualizations, is particularly suited for teams that need speedy and comprehensive data exploration. Its associative data engine allows for intuitive data exploration, making it a strong choice for businesses that need to analyze data quickly.
Lastly, Microsoft Excel, with its widespread use and familiarity, is an excellent choice for those looking for a versatile and reliable tool for basic to moderate data visualization tasks. Its user-friendly interface and integration within the Microsoft 365 suite make it a practical option for many users.
Review methodology
We chose eight top data visualization tools we anticipated would offer different use cases and subjected them to a variety of factors to deliver this review. Firstly, we considered the features of each to ensure that their visualization capabilities are worth recommending. Then, we examined their pricing and value, which was based on the cost and pricing structure while keeping in mind their target users and the cost of their competitors.
We then read through real-world user reviews to understand the experiences of other users with these tools, as well as looking through their websites to note how they approach data visualization. Finally, we tested the tools wherever possible through live demos and trial plans for that valuable hands-on feel.

