


In my recent series of articles, I showed you how to configure Power & Sleep Settings and use Windows 10’s new Battery Saver feature to configure, monitor, and conserve your mobile device’s battery power. Throughout the course of writing these articles I’ve heard from lots of readers who are experiencing shorter battery life and believe that Windows 10 is the culprit. Of course, many factors can come into play and drain a battery at different rates at different times, so generally speaking it is hard to say exactly what the cause could be.
However, you still need to keep in mind that batteries don’t last forever and over time will hold less and less charge until they eventually wear out. To assist you in keeping tabs on the battery itself, Windows 10 (and Windows 8) provides you with a tool for creating a detailed report about the battery in your system. Actually, the report is created by using a special parameter with the PowerCfg command. Let’s take a closer look.
Getting started
Launching the PowerCfg command and running the Battery Report is easy once you know how. To begin, you’ll need to open an Administrator Command Prompt, which you can do by right-clicking on the Start button and selecting the Command Prompt (Admin) command. Then, type the command:
powercfg /batteryreport
and press [Enter]. The Power Configuration Utility will immediately compile the report and display the message shown in Figure A.
Figure A
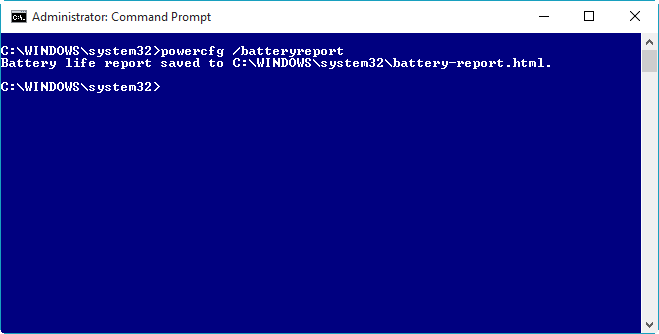
It only takes a moment for the Power Configuration Utility to compile the Battery Report.
Now, just type battery-report.html on the command line. When the Battery Report page loads in your browser, you’ll have to scroll down to view the entire report. As you’ll see, it contains six sections plus the header. To make it easier to look at the report in this article, I have divided my screen shot of the report into separate images corresponding to each section.
Header
The top of the report, shown in Figure B, provides some general information about the computer, including the name assigned to the system, the brand and model of the device, the BIOS version and date, and the operating system build number. It also displays an item called Platform Role, which as you can see is identified as Mobile for this laptop. The next item in this section is Connected Standby. As you can see, this particular laptop is listed as Not Supported. The final item shows the date and time that the report was run.
Figure B
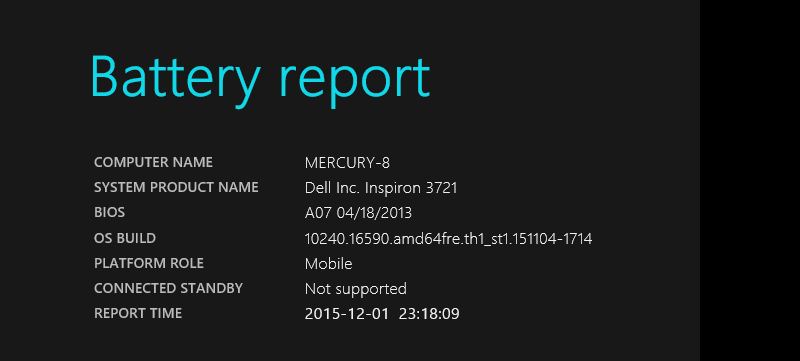
At the top of the report you’ll find some general information about the computer.
Installed Batteries
In the Installed Batteries section, shown in Figure C, you’ll find detailed information about the battery, including the name, serial number, and manufacturer.
Figure C
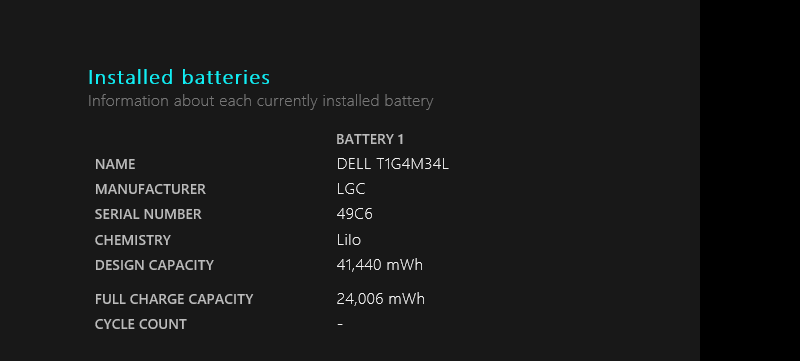
The Installed Batteries section provides detailed information about the battery.
In the case of my example system, the Chemistry is listed as Lilo, which indicates that this is a Lithium battery. The next item is Design Capacity. It represents the amount of a charge that the battery was designed to hold. The value is represented as mWh, which stands for milliwatt hours. (Laptop batteries have a voltage rating (V) and milli-Amp hours (mAH) rating, and they’re multiplied together to come up with the milliwatt hours capacity.)
Following Design Capacity is the Full Charge Capacity, which represents the amount of charge that the battery will actually hold. In the case of my example system, the full charge capacity is actually less than the design capacity. This drop in capacity is directly related to the age of the battery. This battery is two years old, and we’ll find more detail when we get to the Battery Capacity History section in a moment.
The last item in this section is called Cycle Count. This value indicates the number of times the battery has used up 100% of its charge. For example, a cycle could be measured each time the battery has run all the way down and then been recharged. A cycle could also be the result of discharging to 50%, charging to full, then discharging to 50% again. Batteries can go through a limited number of cycles before they are considered consumed. The maximum cycle count value will vary depending on a number of factors, but the battery manufacturer will list a maximum count value in the battery’s specifications.
You may have noticed that the cycle count on my example system is not being reported. Unfortunately, I’ve found this to be the case on many systems I’ve investigated.
Recent Usage
In the Recent Usage section, shown in Figure D, you’ll find a table that lists the power states–Active or Suspended–that the system has gone through over the last three days. It indicates the time the system started, whether the power source was the battery or AC, and the remaining capacity of the battery at the time the entry was made. The capacity remaining shows the percentage as well as the mWh.
Figure D
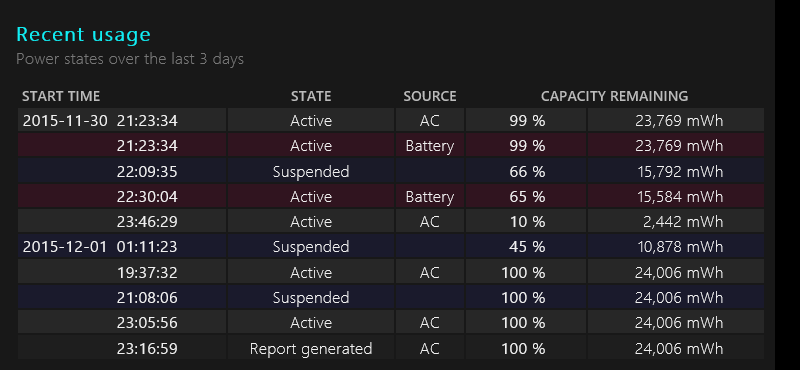
The Recent Usage section displays a table that lists the various power states from the last 72 hours of use.
Battery Usage
The Battery Usage section features a chart and a table that indicates the date and time for each instance when the battery was drained over the last three days. As you can see in Figure E, after one hour and 16 minutes of use on November 30, the battery on this laptop was drained 55% and that equated to 13,142 mWh being used.
Figure E
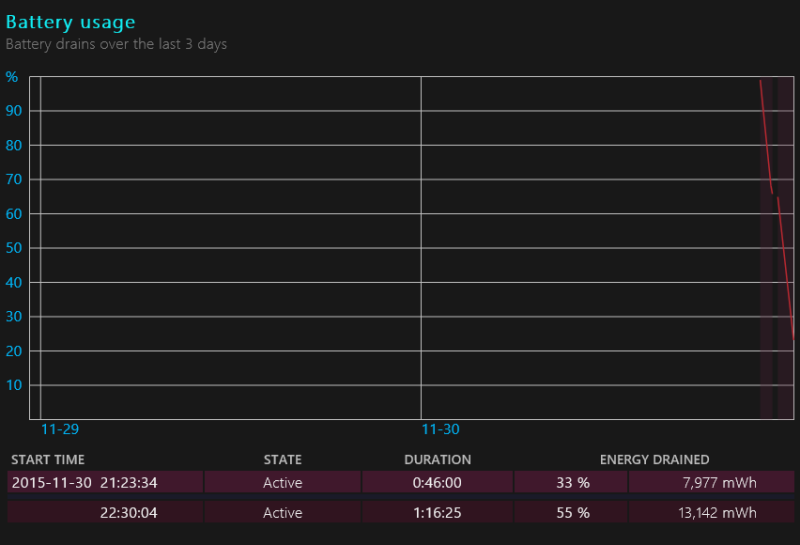
The Battery Usage section features a chart as well as a table.
Usage History
In the Usage History section, shown in Figure F, you’ll find a table that displays the history of system usage on both AC and battery power. The first column shows a usage period–typically seven days–and this may or may not be consecutive set of days, depending on how often you use your system. The table also lists how many hours and minutes within the specified time period the system ran on the battery and how long it ran on AC power.
Figure F
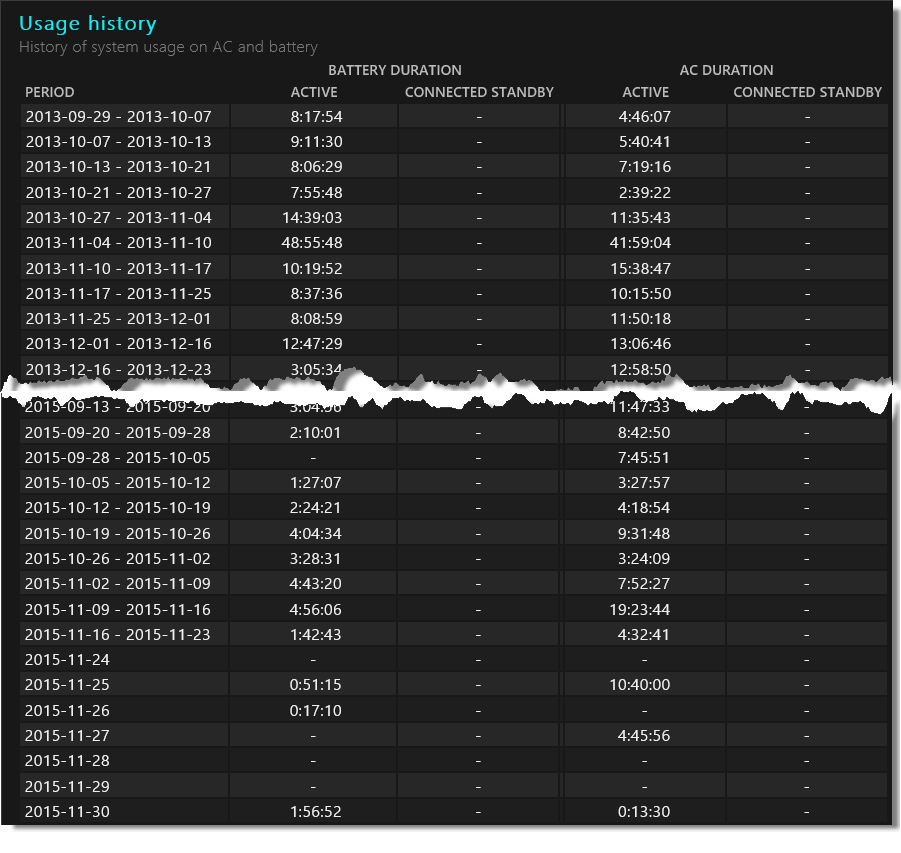
The Usage History section details system usage on both AC and battery power.
Battery Capacity History
The Battery Capacity History section, shown in Figure G, displays the charge capacity history of the system’s battery. This table lists both the full charge capacity and the design capacity, along with a usage period, thus providing you with a way to track the health of your battery over time.
For example, you can see that when I first started using this laptop in September 2013 with Windows 8, the full charge capacity was close to the design capacity–about a 3,000 mWh difference. This is pretty typical.
My example Battery Report also shows that with regular use the first year, the full charge capacity steadily dropped during each measurement period. The difference ended up being a drop of 8,176 mWh.
Figure G
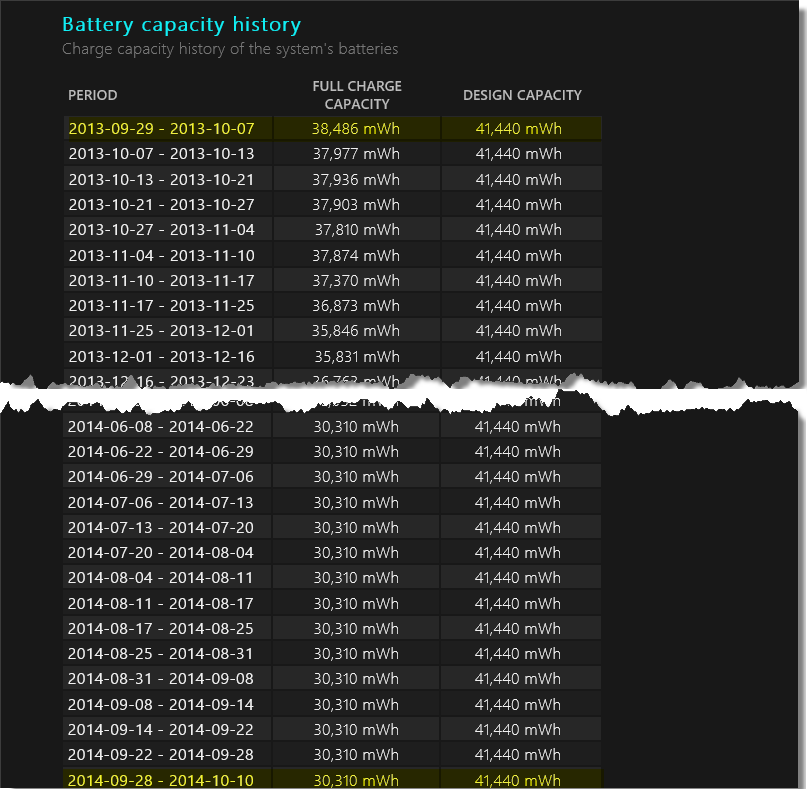
During the first year of regular use, the full charge capacity dropped 8,176 mWh.
After the second year, the full charge capacity continued to drop. The difference ended up being a drop of 3,670 mWh, as shown in Figure H. So over a two-year period, the full charge capacity dropped 11,846 mWh. Over the last several months the full charge capacity has leveled out.
Figure H
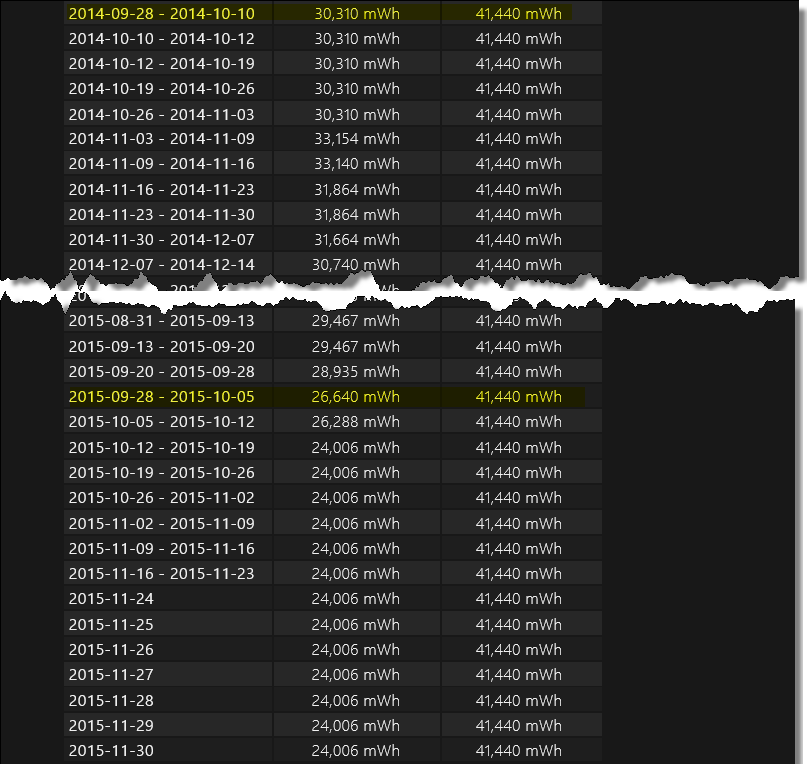
During the second year of regular use, the full charge capacity dropped 3,670 mWh.
As they say, your mileage may vary–but chances are good that you’ll see that your battery is no longer charging to its original full capacity.
Battery Life Estimates
At the end of the report is the Battery Life Estimates section. It includes a table that indicates how long you can expect the battery to last at full charge capacity and at design capacity. These estimates are based on the observed drains. This too will provide you with a good indication of the health of your battery.
As you can see in Figure I, when I first started using this system, I could get about three and half hours of use on a full battery charge; today, I get only about two hours.
Figure I
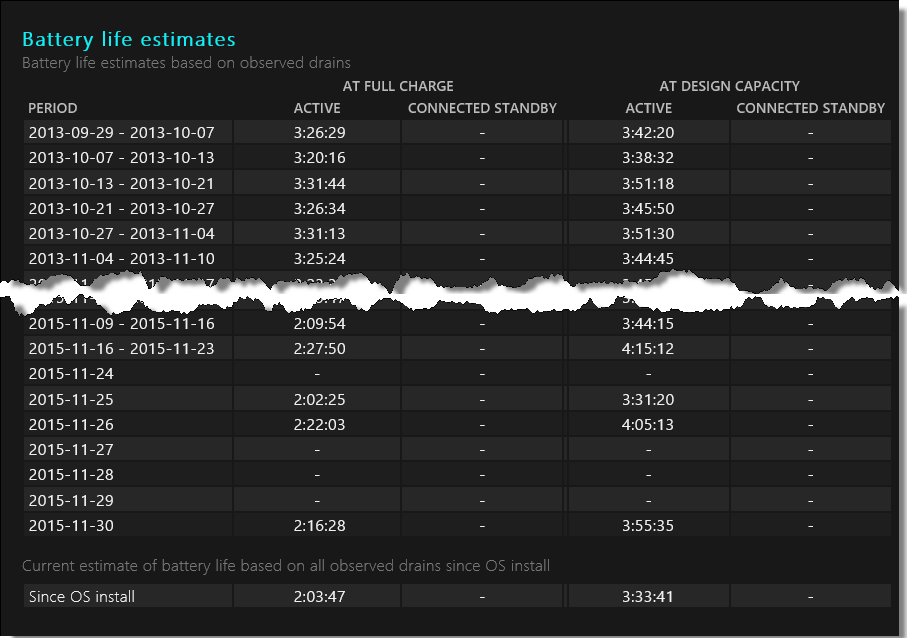
The Battery Life Estimates section shows how long you can expect the battery to last on a full charge.
What’s your take?
Have you run the Battery Report on your Windows 10 system? Have you discovered a drop in the full charge capacity? What’s your laptop’s battery life estimate? Share your experiences in the discussion thread below.
Also read…
Balance efficiency and performance with Windows 10 Power Options
Extend your mobile battery life with Windows 10’s Battery Saver
Which Windows editions let you use Remote Desktop Connection with multiple monitors?
Investigating Windows 10’s Task Manager: More simplicity, more power