


In SaaS and tech environments, growing revenue doesn’t always mean growing profit. Customer acquisition costs, churn, and fixed expenses can delay the point where growth starts to pay off. Breakeven analysis helps you find that point, the moment when recurring revenue fully covers your costs.
It’s a framework that shows how changes in pricing, customer volume, and costs affect profitability. This concept, known as cost-volume-profit (CVP) analysis, helps SaaS and tech teams make smarter decisions about scaling for sustainable growth.
Understanding the relationship between cost, volume & profit
The main idea behind breakeven analysis comes from the relationship between cost, volume, and profit. This is called cost-volume-profit (CVP) analysis. It helps you see how changes in sales volume, pricing, and costs affect your profit.
CVP assumptions
Before performing a breakeven analysis, it’s important to understand the assumptions underlying CVP. The points below are reframed for SaaS and tech businesses but are based on the general CVP assumptions.
- Each subscription tier or service has a consistent selling price within a given period.
- Customer acquisition and service delivery costs stay steady per user, treating them as variable costs.
- Fixed costs such as software development, infrastructure, and support salaries don’t change with customer volume in the short term.
- The mix of customer plans (basic, premium, enterprise) remains the same during analysis.
- All data and revenue from users are assumed to come from normal operations, not one-time contracts or special deals.
- Any changes in sales volume are directly tied to proportional changes in total costs and profits.
People often find CVP assumptions restrictive because they simplify how real businesses operate. In practice, selling prices can change, costs don’t always stay fixed or variable, and customer behavior can shift quickly. These assumptions are meant to make the analysis easier to use and understand, but they don’t always reflect real-world complexity.
To handle real-world complexity, SaaS and tech firms can adjust their CVP models regularly, use scenario planning to test different outcomes, and separate recurring and non-recurring revenue for better accuracy.
CVP relationships in action
This chart shows visually the relationship between cost, volume, and profit. The point (yellow dot) where it stops losing money and begins earning profit is called the breakeven point. It is also the point where revenue equals total costs, resulting in no profit and no loss.
The relevant range (blue dotted lines) at the top reminds you that this model only makes sense within a certain range of sales or customers, not extreme scenarios where costs or prices might change dramatically. So going beyond will produce unreliable information that can be used for decision-making.
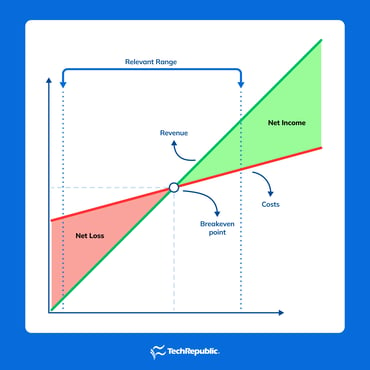
Imagine a SaaS company that sells a task management app through monthly subscriptions. At first, the business spends more on development, hosting, and support than it earns, placing it in the red, net loss area of the chart. As more users subscribe, its revenue line rises until it meets the cost line at the breakeven point, where income finally equals expenses.
Beyond that point, the company enters the green net income area, meaning it’s now earning profit. The relevant range at the top reminds you that this pattern holds only under normal operating conditions, where costs and prices remain relatively stable.
Breakeven point for SaaS & tech firms
Traditionally, the breakeven point formula is:
B/E point = Fixed cost ÷ (Revenue – Variable costs)
This formula works in general, but it’s not quite tailored for SaaS and tech firms. The formula above is more suitable for manufacturing and retail businesses where variable costs can be easily determined. But for service-based SaaS and tech firms, determining costs can be difficult. Hence, we’ll approach this in a different way using the modified formula below:
B/E point = Fixed costs ÷ [1 − (CAC ÷ LTV)]
Where:
- CAC = Customer acquisition cost
- LTV = Lifetime value of a customer
Computing CAC and LTV
The CAC is the total amount a company spends to gain one new paying customer. It includes all marketing, sales, and promotional expenses. For SaaS and tech firms, CAC is a key metric for measuring how efficiently they grow. When acquisition costs are high, it can slow down cash flow and delay the point at which the business starts earning profit.
CAC = Total marketing & sales spend ÷ No. of new customers acquired
The LTV shows how much gross profit a company expects to make from a customer over the whole time they stay subscribed. In SaaS models, this means looking at recurring revenue, customer retention, and profit margins. A higher LTV means customers are loyal and keep generating income long after they sign up.
LTV = (Average revenue per user × Gross margin) ÷ Churn rate
Where:
- Average revenue per user = Total recurring revenue ÷ No. of active customers
- Gross margin = 100% − Cost of goods sold ratio
- Churn rate = Customers lost ÷ Customers at start of the period
Hence, the LTV-to-CAC ratio compares how much profit a company earns from each customer to how much it spends to acquire them. For SaaS and tech firms, this ratio shows how scalable and efficient the business is. A ratio around 3:1 is generally considered healthy, meaning the company earns three times more from a customer than it spends to get them. A lower ratio signals high costs, while a much higher one might mean the company isn’t investing enough in growth.
Breakeven point example
A SaaS company called TaskPilot offers a subscription project management tool. Here are details about TaskPilot’s numbers:
- Each month, the company spends $120,000 on fixed costs (engineering salaries, office tools, management) and incurs $25 in variable costs per user (for hosting, support, and payment fees).
- The average customer pays $100 per month for the subscription, and the marketing team spends $60,000 in sales and marketing to acquire 300 new customers each month.
- The company’s gross margin is 80%, and its monthly churn rate is 5%.
1) Determine the CAC
CAC = $60,000 ÷ $300 = $200 per customer
It means that TaskPilot spends $200 to acquire a new customer.
2) Determine the LTV
LTV = ($100 × 80%) ÷ 5% = $1,600 per customer
This means that TaskPilot’s customers can generate $1,600 in gross profit over the life of their subscription.
3) Determine the breakeven point
B/E point = $120,000 ÷ [1 – ($200 ÷ $1,600)] = $120,000 ÷ (1 – 0.125) = $137,143
Interpreting the breakeven point in a SaaS & tech firm perspective
Now we know that TaskPilot’s breakeven point in sales is $137,143. This means the company must reach $137,143 in sales just to cover all its costs — no profit yet, no loss either. To start earning profit, TaskPilot needs to sell more than that amount; if sales fall below it, the business will operate at a loss.
To put it in a clearer perspective, let’s look at the customer level. In the example above, the average customer pays $100 per month. So, given TaskPilot’s breakeven point, we can compute this:
Customers required at B/E point = $137,143 ÷ $100 = 1,371 customers
So, TaskPilot needs 1,371 customers to reach breakeven and 1,372 customers to start earning its first dollar of profit. This figure is important because it shows exactly how many customers a SaaS or tech firm needs to cover its costs and begin generating real earnings.
Thinking beyond the breakeven point
Yes, the breakeven point tells us the exact sales level where there’s no profit or loss — just enough to cover all costs. But that’s only the starting line. What really matters is knowing how much sales or how many customers are needed to move past that point and start earning profit.
To do this, we can modify the breakeven formula to include a target profit margin, giving a clearer picture of the sales required to reach actual profitability.
B/E point with target profit = Fixed costs ÷ [1 − (CAC ÷ LTV) × (1 − P)]
Let’s use our previous example and assume that TaskPilot aims for an ambitious 20% target profit margin.
B/E point with target profit = $120,000 ÷ (1 − 0.125) × (1 − 20%) = $120,000 ÷ 0.7 = $171,429
Now, TaskPilot needs to generate $171,429 in sales to both break even and achieve its 20% target profit margin. This turns the breakeven point into a real profit goal instead of just a cost-covering benchmark. Setting a target like this is important because it helps TaskPilot plan for growth, price its services strategically, and make sure every sale contributes to long-term profitability.
More about Finance
- What Is Accounting? Definition, Types, Importance and Examples
- Best Accounting Software and Services
- Verito vs. Rightworks: Which IT Provider Is Best for Your Firm?
- Top Free Accounting Software
- Accounting Glossary
Measuring resilience in your numbers
As a business, you want to feel secure about your financial position. It’s common to ask, “Am I in the red?” That’s where the margin of safety (MoS) comes in. It acts as your business’s resilience gauge, showing how much cushion you have before slipping into a loss.
The MoS is often overlooked but extremely practical for SaaS and tech firms. It goes beyond just knowing where breakeven happens because it helps leaders measure how much risk they can handle, how flexible their pricing can be, and how stable their operations truly are.
MoS = Actual sales − Breakeven sales
Let’s see how that formula works in action. Suppose TaskPilot’s actual sales reach $225,000. Using the breakeven point with its target profit, the MoS comes out to $53,571. This is a good sign because it means TaskPilot has a healthy sales cushion, and revenue could drop by that amount before the business would risk falling below its profit goal. It shows stability and gives leaders confidence that short-term changes in sales won’t immediately push the company into a loss.
Here are some reasons why MoS is a metric that you should be looking at:
- Runway and cash flow protection: MoS shows how much your revenue can drop before you run out of cash or need to cut costs. A higher MoS means you have more breathing room if sales slow down or the market shifts.
- Churn and retention check: For SaaS firms that rely on subscriptions, MoS helps you see how much customer loss you can handle before profits disappear. If churn suddenly increases, your MoS gets smaller, a sign your business is becoming more fragile.
- Pricing and discount decisions: MoS helps you test how much you can adjust prices without hurting profit. It’s useful when trying new pricing tiers, discounts, or free plans.
- Investor confidence: A strong MoS tells investors your business can handle slow sales or market changes without taking heavy losses. It shows solid cost control and financial discipline.
- Scenario planning: MoS helps finance teams plan for best, expected, and worst cases. It shows when to adjust spending, pause hiring, or raise prices before losses happen.
- Performance comparison: MoS can be used to compare how different products or departments perform financially. A higher MoS means better pricing power, stronger retention, or lower costs.
Measuring how profit reacts to sales changes
In SaaS and tech companies, the degree of operating leverage (DOL) shows how sensitive profits are when sales go up or down. In simple terms, it tells you how much your profit might grow or shrink when revenue changes, which is something that really matters for software businesses that have big upfront costs but low costs per customer.
The DOL acts like a sensitivity gauge for your business. If your profit doesn’t change much when sales or costs fluctuate, it means you have strong operating leverage and your fixed cost structure can absorb sudden drops in revenue without an immediate hit to profit.
DOL = Contribution margin ÷ Operating income
Let’s say here are TaskPilot’s updated numbers:
- Fixed Costs = $100,000 per month
- Price per customer (subscription) = $100/month
- Variable Cost per customer = $20/month
- Number of active customers = 2,000
1) Compute contribution margin
CM = Price per customer − Variable cost = $100 − $20 = $80 per customer
Total CM = $80 per customer x 2,000 customers = $160,000
2) Compute operating income
OI = Sales − Variable costs − Fixed costs = $200,000 − $40,000 − $100,000 = $60,000
3) Determine the DOL
DOL = Contribution margin ÷ Operating income = $160,000 ÷ $60,000 = 2.67
TaskPilot’s DOL is 2.67, which means that for every 1% change in sales, operating profit will change by about 2.67% in the same direction. This tells us TaskPilot’s profits are quite sensitive to sales changes, where a small increase in revenue can boost profits quickly, but a small drop can also shrink them fast.
For SaaS firms, a higher DOL reflects the power and risk of a fixed-cost model: once sales grow, profits scale rapidly, but maintaining steady revenue is crucial to avoid large swings in earnings. Here’s what DOL can tell about your business:
- Scalability indicator: A high DOL shows how efficiently your business scales once fixed costs are covered. Since software has almost no extra cost per user, every new customer adds more profit, making growth highly efficient.
- Risk sensitivity: The same leverage that boosts profits can also magnify losses when sales slow down. A high DOL means revenue drops hit harder, so finance teams watch it closely to manage spending and keep cash flow stable during slower months.
- Investor signal: Investors and CFOs look for improving DOL as annual recurring revenue (ARR) grows. It shows the company can turn revenue increases into stronger profit margins, proving the business model is scaling effectively.
- Cost optimization planning: Knowing your DOL helps decide when to shift focus from growth to improving margins. For instance, lowering hosting or support costs can reduce DOL volatility and make profits more predictable.
- Scenario analysis: DOL makes forecasting more realistic by showing how sensitive profit is to sales changes. For example, if sales rise by 15% and your DOL is 6, operating profit could jump by about 90%. This insight is key for planning and board reporting.
Caveats in breakeven and CVP analysis
While CVP analysis gives smart insights into how your service performs, it’s not a magic formula that guarantees growth. It comes with limitations you need to understand so you can make realistic decisions and apply its insights in a practical way.
- Some fixed and variable Costs are hard to separate. In tech, costs don’t stay perfectly “fixed” or “variable.” Cloud servers might stay flat until usage hits a limit, then suddenly spike. Engineering feels fixed, but it expands as the product and user base grow. Customer success teams usually scale in chunks, like hiring one rep for every few hundred customers. Because of this, classifying costs neatly doesn’t always hold up over time, making it hard for you to have data to conduct CVP analysis.
- Assumes one price fits all. CVP assumes every customer pays the same price (or an average price) and has the same profit margin. In SaaS, that’s not always realistic. Enterprise clients and small businesses pay very different rates. Discounts, seat-based plans, and upsells all shift margins. A single average revenue per customer is just an average, and it doesn’t show how margins actually move between segments.
- Assumes unlimited capacity. Break-even models assume you can keep scaling forever without friction. In reality, SaaS companies hit walls like servers need upgrades, onboarding teams get overloaded, and support queues grow. Each capacity “step” adds new fixed costs, shifting your break-even point upward temporarily.
- Leaves out external shocks. CVP doesn’t factor in things like new competitors, pricing wars, inflation, or global exchange rate swings. Customer adoption patterns can also shift suddenly. Any of these can change your cost base or margins overnight, making past break-even estimates outdated.
- Doesn’t show if you’re using capital wisely. Hitting break-even doesn’t mean you’re making the best use of your money. A team could hit break-even on one product but miss better opportunities elsewhere. CVP tells you when costs are covered, not whether your resources are driving maximum growth.
- Creates false confidence. Finally, CVP results often look more precise than they really are. They’re estimates, not guarantees. A 10% to 15% margin of error is normal. Treat CVP as a directional tool, then back it up with cohort data, scenario analysis, and historical trends before making decisions.
Frequently asked questions (FAQs)
What is breakeven analysis?
Breakeven analysis helps you find the point where your business covers all its costs—no profit, no loss. It shows how much you need to sell to start making money.
How to do a breakeven analysis
Start by listing your fixed costs (like rent or salaries) and variable costs (like materials or hosting fees). Then, apply the breakeven formula to see the sales volume you need to cover those costs.
What is a breakeven analysis used for?
It helps you plan pricing, forecast profits, and make smarter financial decisions. By knowing your breakeven point, you can see how close you are to profitability and adjust your strategy if needed.