


Key takeaways:
- Burndown charts give teams a visual snapshot of progress, showing how much work or budget remains compared to the time available so managers can detect delays early and adjust workloads efficiently.
- They come in three types, including sprint, release, product, and budget burndown charts, each designed to track performance at different stages of a project.
- The value of a burndown chart depends on updates and accurate task estimates, which ensure it reflects real performance and supports better forecasting.
Managing task progress in fast-moving projects often becomes difficult when deadlines overlap or priorities change. Burndown charts solve this by visualizing how much work remains against the project timeline. In this article, I explain how to create a burndown chart and share pre-built templates you can use right away.
What is a burndown chart?
A burndown chart tracks how much work remains compared to the time available. It typically appears as a line graph, with time plotted along the horizontal axis and remaining work shown on the vertical axis.
Agile and Scrum teams use burndown charts to monitor progress throughout sprints or projects. This allows them to evaluate performance against goals, identify delays ahead of time, and detect bottlenecks by comparing progress to the project schedule to spot any variances.
Burndown charts are often compared with burnup charts, as both visualize project progress but from opposite perspectives. A burndown chart shows how much work remains over time, while a burnup chart displays how much work has been completed toward the total scope.
Types of burndown charts
Burndown charts come in three types:
| Sprint burndown chart | Tracks the amount of work remaining within a single sprint. | Short-term, usually one to four weeks. | Scrum teams managing daily progress within sprints. | Shows how quickly tasks are being completed and if the team is on pace to finish the sprint on time. |
| Release burndown chart | Measures progress toward a major release or milestone that spans multiple sprints. | Medium-term, typically several sprints or months. | Product managers and Agile teams planning feature rollouts. | Highlights the amount of work remaining before a product release and forecasts delivery dates. |
| Product burndown chart | Tracks the overall progress of an entire product or long-term project. | Long-term, covering the full product lifecycle. | Leadership teams and stakeholders monitoring strategic progress. | Provides a high-level view of how cumulative work is trending toward project completion. |
| Budget burndown chart | Monitors how financial resources are being used against planned budgets. | Varies depending on project scope and funding cycles. | Project managers and finance teams managing project costs. | Shows how spending aligns with budget limits and helps detect potential cost overruns. |
Who uses a burndown chart?
Burndown charts are often used within agile methodology where project managers and product development teams rely on them to ensure transparency and accountability.
- Scrum masters use burndown charts to track team performance and ensure sprint goals align with timelines.
- Product development teams rely on them to measure feature completion rates and detect early signs of scope creep.
- Project managers use burndown charts to evaluate progress against milestones and communicate updates to stakeholders.
- Software developers view them as a feedback tool to understand workload distribution and make timely adjustments that improve sprint efficiency.
What are the components of a burndown chart?
The appearance and complexity of the burndown chart varies depending on the project scope. But they all share key components you should understand before using or creating one.
- Horizontal axis represents time, often divided into days or sprints, showing how work is expected to progress throughout the project.
- Vertical axis indicates the total remaining work, which can be measured in hours, story points, or task count.
- Actual work remaining line displays real progress over time, helping teams see if they are on pace or falling behind.
- Ideal work remaining line serves as a reference point that shows the projected pace needed to complete all tasks by the deadline.
How to create a burndown chart
Creating an agile burndown chart is straightforward once you understand what data to track. Pre-built templates are available through project management software, but if you prefer to make one from scratch, here’s a step-by-step guide to help you:
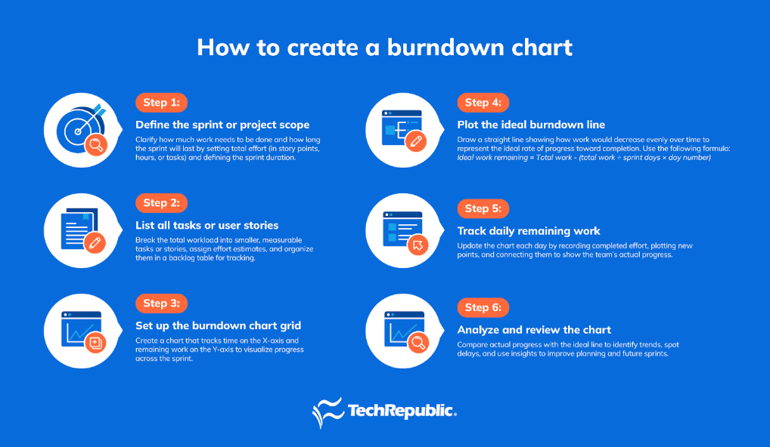
Step 1: Define the sprint or project scope
Before getting started, define the full scope of your sprint or project by identifying the total effort and the sprint length. Total effort refers to the overall workload, measured in story points, hours, or task counts, while sprint length defines the number of days or weeks allocated for completion.
- Total effort: Use story points, hours, or task counts.
- Sprint length: Most teams use one to four weeks.
For example, in a two‑week sprint with 100 story points, the total effort equals 100 spread across 10 working days (excluding weekends).
Step 2: List all tasks or user stories
Once the scope is defined, divide the total effort into smaller tasks or user stories. Each item should have its own effort estimate to make tracking progress easier. Agile teams usually rely on story points, whereas traditional teams often use hours or task counts.
Once the estimates are set, add all tasks to a backlog table. This can be created in a spreadsheet or project management software, preferably in the same tool you use to build the burndown chart.
Step 3: Set up the burndown chart grid
When using project management software, burndown charts may be included in the application’s default templates. If not, you’ll need to create one manually in a spreadsheet by setting up a blank grid for tracking time and remaining work. Create the X-axis to represent the sprint timeline and label each unit with a sprint day, starting from Day 1 and continuing through the final workday of the sprint.
Next, set up the Y-axis to track the remaining work. This axis should start at the top, with the total effort defined during sprint planning (e.g., 100 story points, 40 hours, or the total number of tasks), and decrease incrementally to zero at the bottom.
Step 4: Plot the ideal burndown line
This line shows the perfect scenario where work is completed evenly across the sprint. Draw a straight diagonal line from the top-left corner (Day 0, full effort) to the bottom-right corner (last day, zero effort). To calculate the ideal effort remaining for each day, use the formula below:
Ideal work remaining = Total work – (total work ÷ sprint days × day number)
Step 5: Track daily remaining work
At the end of each day, record the actual remaining effort and subtract the completed work from the total. Here’s an example:
Day 1: 100 → 90 (10 points completed)
Day 2: 90 → 85 (5 points completed)
Once you’ve tracked the remaining effort, plot each day’s value on the burndown chart. Connect these points with a line to visualize your actual burndown trend. This line shows how the team is efficiently reducing the backlog throughout the sprint.
Step 6: Analyze and review the chart
As your project advances, observe how the actual progress line aligns with or diverges from the ideal line. The difference helps identify delays or faster-than-expected progress.
You can use the chart to guide future planning by analyzing where progress slowed or accelerated. Regular updates turn the burndown chart into a feedback tool for better forecasting and sprint retrospectives.
What are burndown chart examples?
Project management platforms offer burndown chart templates that enhance visualization through interactive tools and automation. Here are examples of burndown charts available across different tools and how they differ in design and functionality.
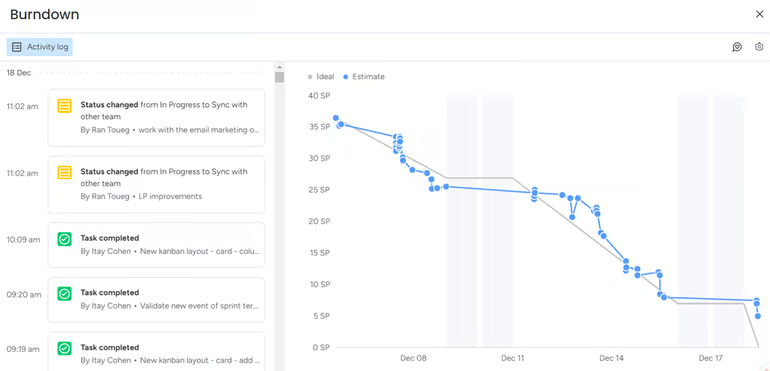
1. Monday work management – Best for automation
monday integrates burndown data with activity logs by showing task updates alongside the visual graph. This built-in tool updates automatically as users mark items complete, while the timeline reflects real progress against estimates. The system pulls information directly from the activity log, so each point on the chart reflects actual performance against the ideal line. This setup benefits teams that want to connect task updates with sprint performance in one interface.
2. ClickUp – Best for integrated workflows
ClickUp’s burndown chart uses a grid-based layout rather than a traditional line graph, allowing teams to track work completion across weeks or sprints visually. Each colored block represents sprint points, showing what’s completed and what remains. It supports customization, enabling users to set goals and measure progress directly from task data within ClickUp’s workspace.
3. Jira – Best for agile sprint monitoring
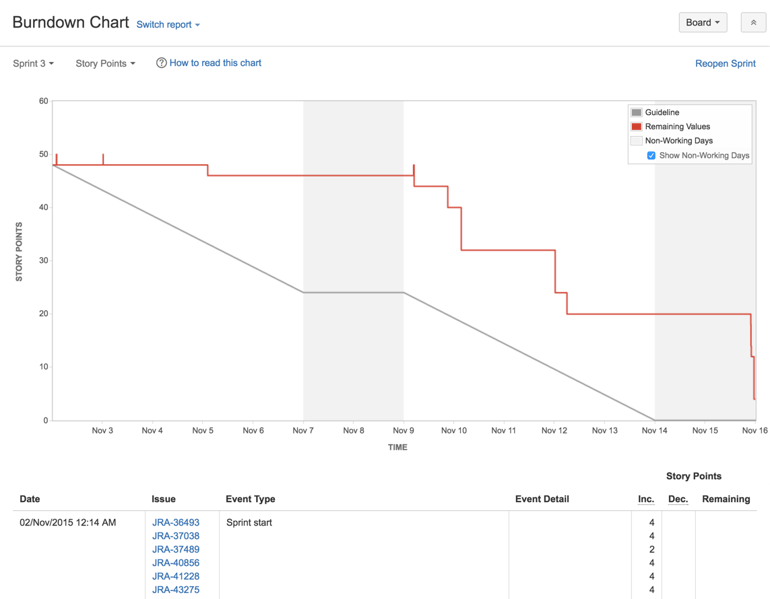
Jira’s burndown charting tool is a built-in feature that automatically pulls sprint data and plots actual progress against an ideal line. The vertical axis represents story points, and the horizontal axis shows sprint days. It’s suited for Agile teams that need real-time tracking and automated calculations based on issues completed or reopened.
4. Miro – Best for visual planning
The Miro version serves as a collaborative whiteboard layout for sprint planning. It uses a grid to map time intervals and workload, combining simplicity with flexibility for visual collaboration. Teams use this format for sprint retrospectives or high-level planning sessions where visual clarity is necessary.
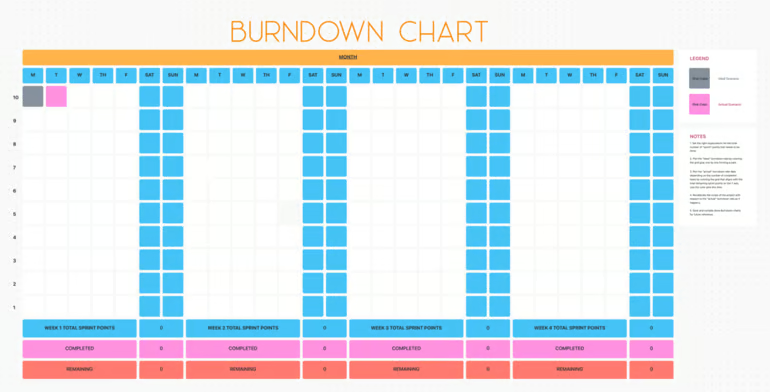
5. Smartsheet – Best for spreadsheet-style format
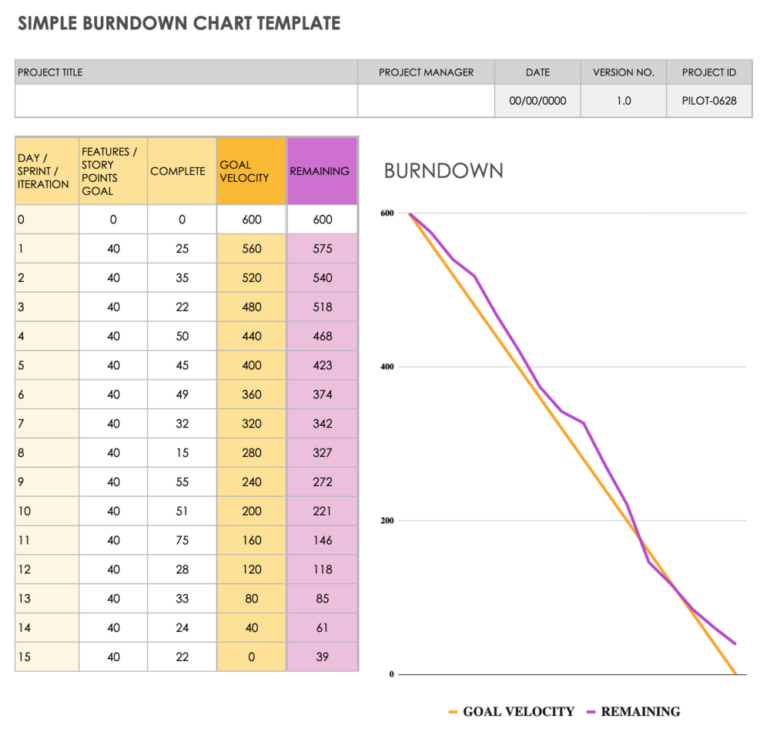
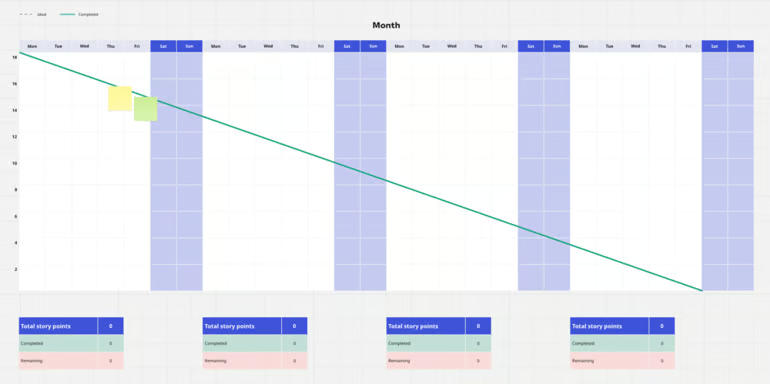
This version offers a spreadsheet-style layout that combines task lists with visual tracking. It uses weekly sprint boxes with color-coded columns for sprint days, story points, and remaining work, while the graph beside it shows progress against goal velocity. It’s ideal for teams that prefer manual input and full control over data visibility in Excel or Smartsheet.
How to read a burndown chart
Reading a burndown chart means comparing the remaining work against the project timeline to evaluate progress and forecast completion. The horizontal axis shows time, while the vertical axis displays remaining effort measured in hours, tasks, or story points. The ideal line represents the planned rate of completion, and the actual line shows how work is progressing in reality.
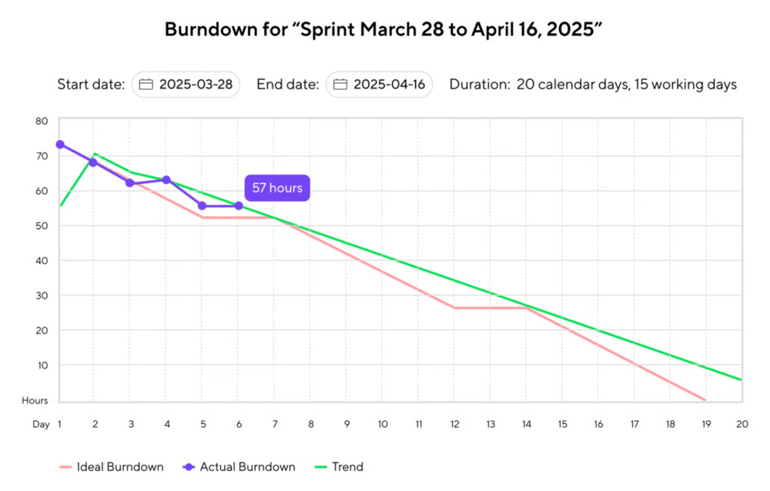
In Wrike’s burndown chart, you can interpret progress by comparing the three lines over time. The red ideal line shows how work should decline evenly if the team is on pace, while the violet actual line represents real progress as hours are completed. The green trend line projects future performance based on current progress. For example, if the violet line rises above the red line mid-sprint, as shown in the image, it means the team is behind schedule and must complete more work per day to reach the goal before the April 16 deadline.
Benefits & limitations of burndown charts
Here are the benefits and limitations of burndown charts to help you understand their advantages and where they may fall short in project tracking.
Benefits
- Improves visibility: Provides a visual representation of remaining work compared to planned progress, making it easy for teams to understand status and identify risks early.
- Supports better forecasting: The chart’s slope helps predict whether goals will be met within the sprint or project timeline.
- Encourages accountability: Each update reflects team effort, motivating members to focus on sprint goals.
Limitations
- Lacks context for changes: The chart shows what changed but not why. It doesn’t explain delays, scope changes, or effort variations.
- Overlooks task complexity: Equal story points may hide varying difficulty levels, which can distort the actual pace of work.
- Requires consistent updates: Without frequent data input, the chart loses reliability and can mislead project decisions.
FAQs
Is a burndown chart part of a Scrum?
Yes. In Scrum, a burndown chart is a tracking tool that shows how much work remains in a sprint. Teams can visualize progress toward sprint goals and support daily stand-ups, sprint reviews, and planning by revealing whether the team is on track to complete all tasks.
What is an ideal burndown chart?
An ideal burndown chart shows a smooth, consistent downward slope from the total estimated work to zero by the sprint’s end. This steady decline means the team completes work at a predictable pace, indicating balanced workload distribution and accurate sprint planning.
What is the difference between burndown and burnup charts?
A burndown chart tracks remaining work decreasing over time, while a burnup chart tracks completed work increasing toward the total goal. Burndown charts emphasize what’s left to finish, whereas burnup charts highlight progress made and make it easier to see when scope changes occur.