These are some of the new features in Excel 2013 that users should get to know. You can see these and a couple more picks in the original blog post, 10 best new features in Excel 2013.
Flash Fill
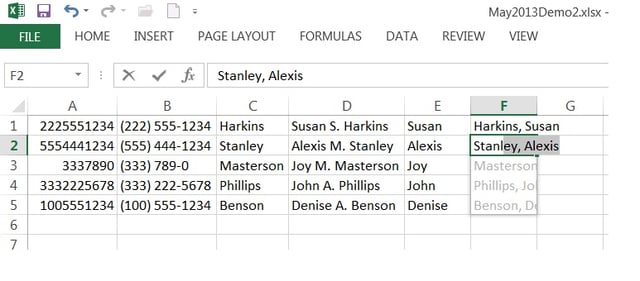
Perhaps the closest thing to magic Excel users will ever see in a \r\nworkbook is Flash Fill. This feature anticipates formatting and data \r\nrequirements by recognizing patterns so it can finish what you start. This screenshot shows a typical use for Flash Fill. First, I transposed a \r\nrecord’s name value into last name, first name order. While doing the \r\nsame for the second record, Flash Fill recognized a pattern and \r\nsuggested possible entries to complete the column. When Flash Fill \r\ndisplays this list, you have two choices: Press Enter to complete the \r\nlist or press [Esc] to remove it. To learn more about this feature, read\r\n Excel 2013 Flash Fill anticipates needs on the fly.
Recommended Charts
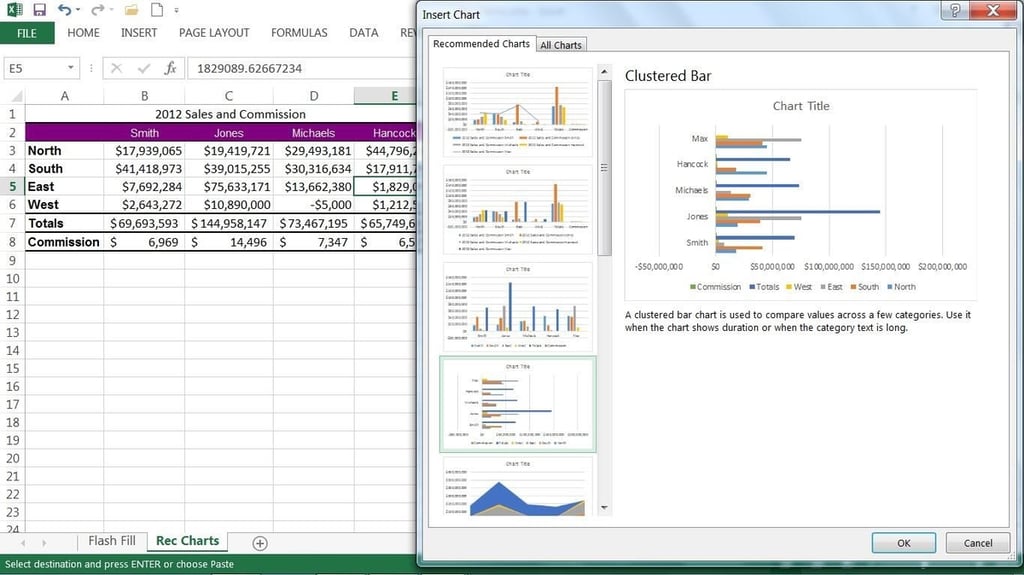
Most users don’t always know the best chart type for their data. \r\nRecommended Charts takes the guesswork out of the process. Simply click \r\ninside the data you want to chart, click the Insert tab, and click \r\nRecommended Charts to see a collection of suggested chart types, as \r\nshown above. Then, click a thumbnail to preview your data \r\nas that chart type. Double-click a thumbnail to embed the chart. Using \r\nthis feature lets you work with confidence knowing the chart will \r\nhighlight your data in a meaningful way.
Recommended PivotTables
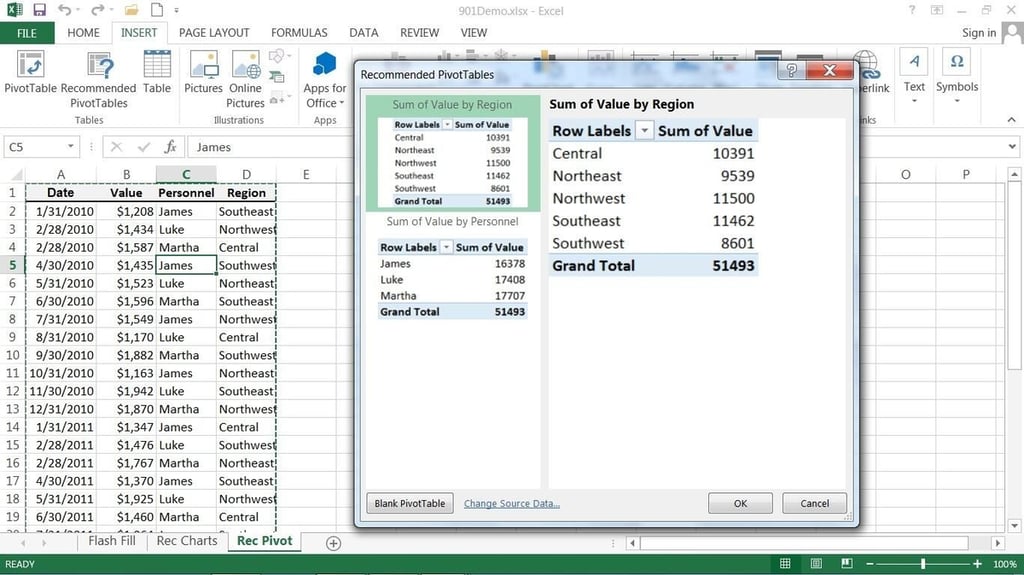
This feature works similar to Recommended Charts, but generates a quick \r\nPivotTable. It’s a great new feature for most users, because so many of \r\nus struggle with PivotTables. Click inside the data range (which must \r\nhave header cells) and click the Insert tab. In the Tables group, click \r\nRecommended PivotTables to display the dialog shown above. Select a thumbnail and click OK to embed an effective PivotTable in a new sheet.
Quick Analysis
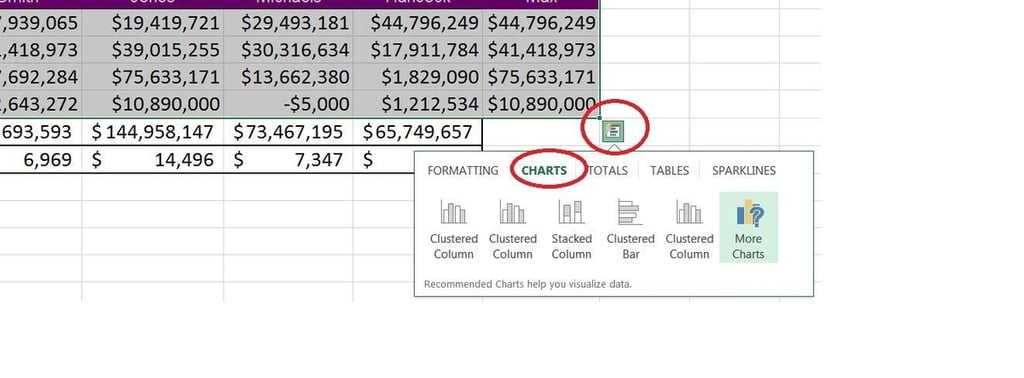
Use Quick Analysis to quickly preview your data in meaningful ways. \r\nFor instance, Quick Analysis offers a second new way to generate \r\nappropriate charting for your data. Select the data and then click the \r\nQuick Analysis icon at the bottom-right, as shown above. Click the Charts tab to view the suggested chart types. If you don’t see this icon, check your settings:
Click the File tab and choose Options from the left pane.
Choose General in the left pane (the default).
In\r\n the User Interface Options section, the Show Quick Analysis Options On \r\nSelection option should be checked. Enabled is the default, so you \r\nshould see this icon unless someone has changed this setting.
Click OK.
Timelines
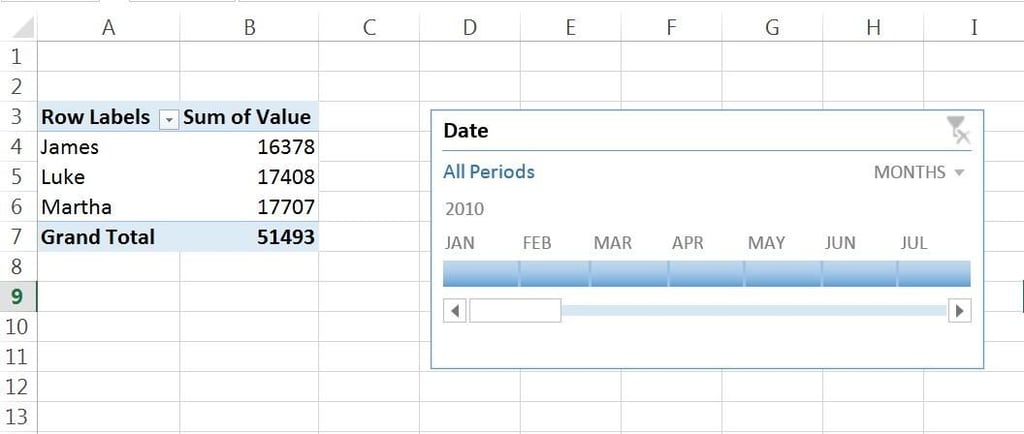
A timeline lets you filter records in a PivotTable—it works similar to a slicer, but you’ll filter by dates. For instance, here is a PivotTable and timeline. (I used the same data range used in \r\n#3.) Once you have a PivotTable arranged, adding the timeline is simple:\r\n
With the PivotTable selected, click the contextual Analyze tab.
In the Filter group, click Insert Timeline.
In\r\n the resulting dialog, check the date field (in this case, that’s Date) \r\nand click OK. Excel will embed the timeline alongside the PivotTable.
Cloud support
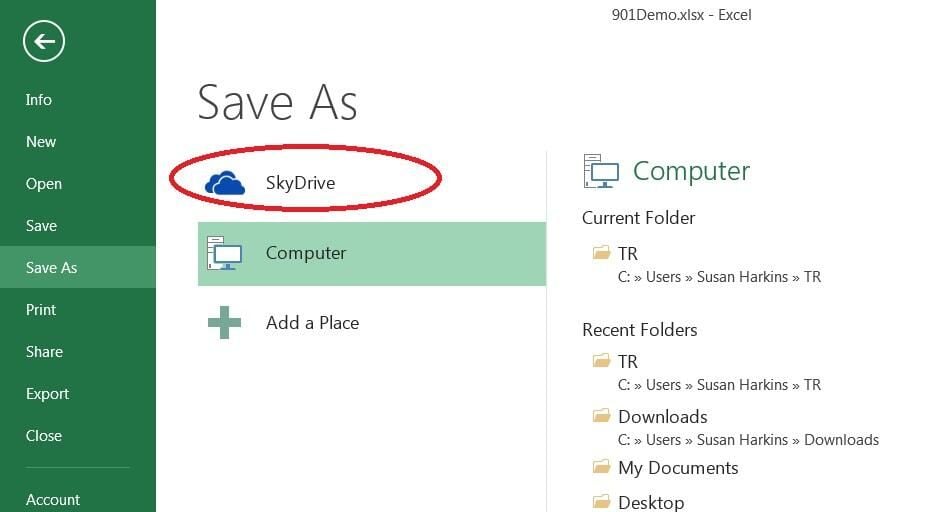
Microsoft claims that its cloud support is the true shining star of \r\nthe Office 2013 suite. If you need it, you probably agree; many \r\norganizations aren’t taking full advantage of it yet. If you’re curious,\r\n you can quickly hook up to SkyDrive or your organization’s SharePoint \r\nteam site by using the Save As (or Open) screen. Doing so has two advantages:
You\r\n have quick and easy access to your Excel files on any device that runs \r\nExcel 2013 (including a Windows tablet and smartphone).
Using Office 365 (you’ll need a subscription), you can review and edit your workbooks online using almost any web browser.
Apps for Office
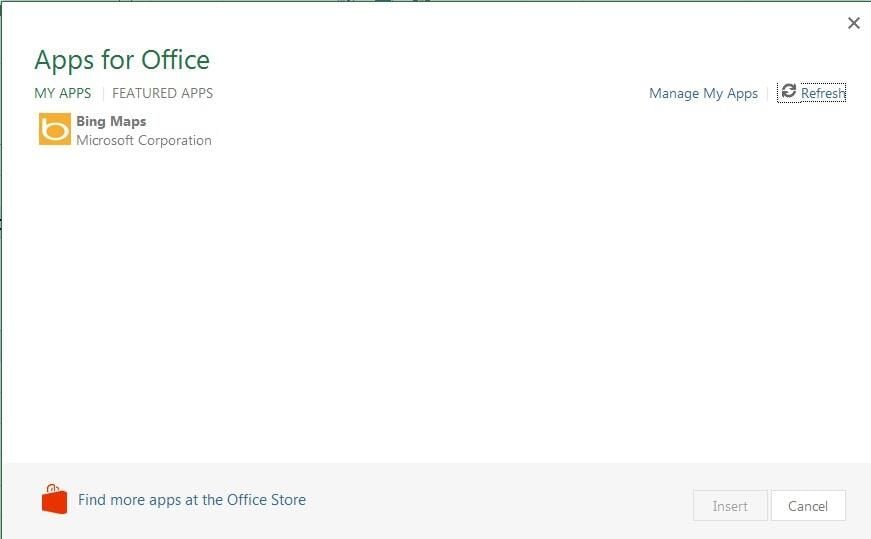
This new feature provides quick access to specialized programs at Office\r\n Store. Just a quick click and you’re shopping! To install an app, click\r\n the Insert tab and then click Apps for office in the Apps group. You’ll\r\n need an account at the store, which the feature will help you create \r\nthe first time you use it. This slideshows Bing Maps as an installed app.
Susan Sales Harkins is an IT consultant, specializing in desktop solutions. Previously, she was editor in chief for The Cobb Group, the world's largest publisher of technical journals.