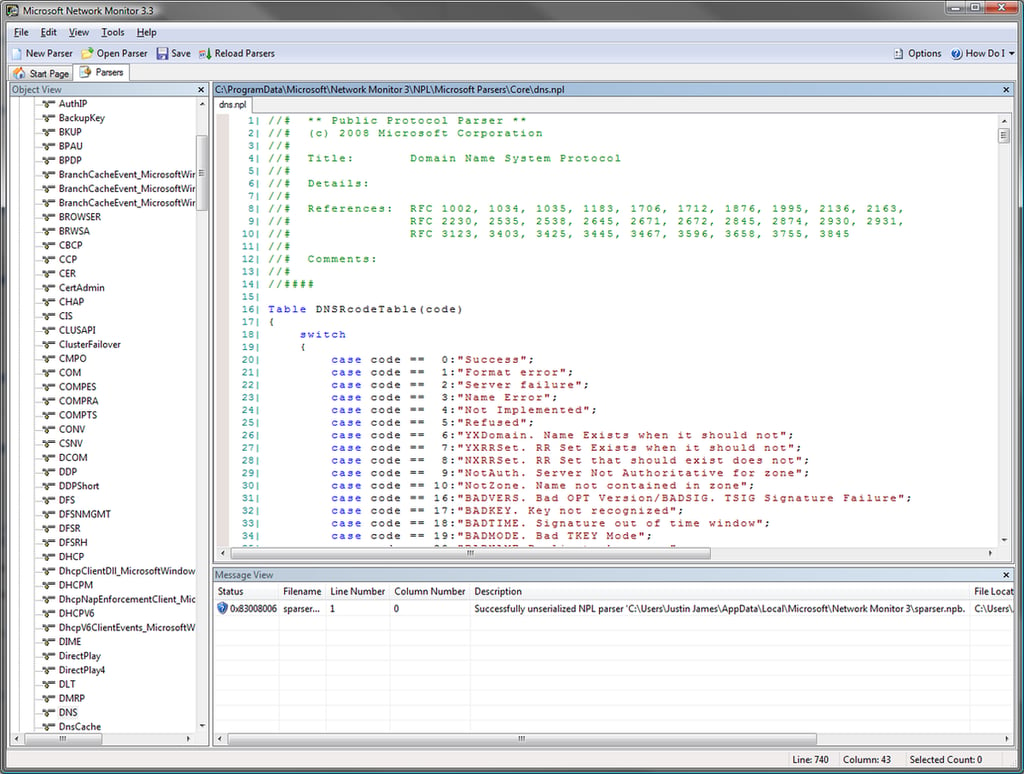
The Parsers tab allows you to create and modify the various parsers. This would come in handy to debug an application that uses a custom protocol, for example.
Images by Justin James for TechRepublic
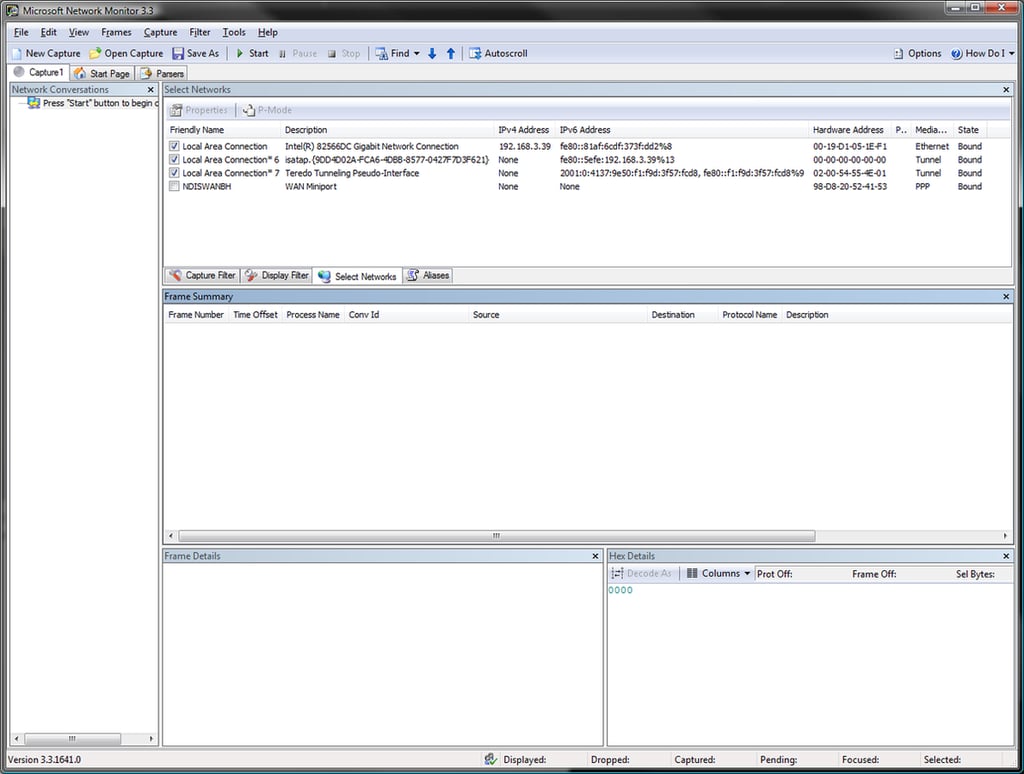
When you start a new capture, you can select which network adapters (including VPN connections) that you wish to monitor. If you do not select the VPN connection, then the traffic over that tunnel will still appear in the actual NIC itself, but the capture will not be aware of the data within tunnel beyond the bytes themselves going through it.
Images by Justin James for TechRepublic
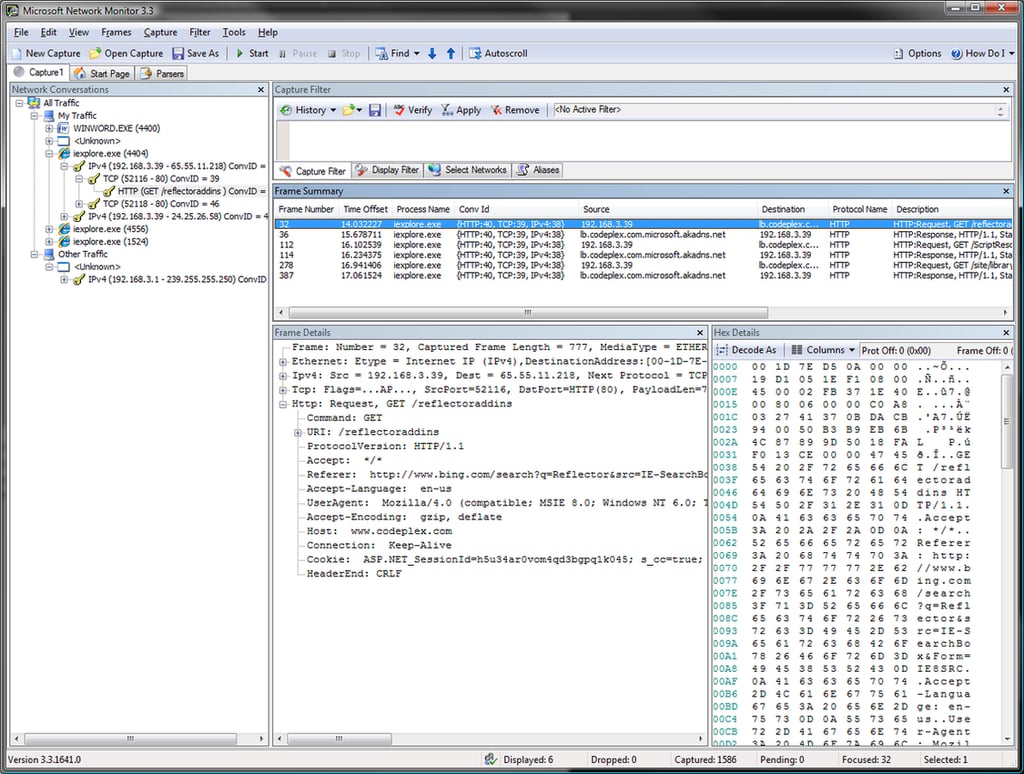
This is what an in-depth view of an individual frame looks like. Because this is an HTTP transmission, and there is a parser for HTTP, you can see how the display can turn the data into a useful tree. This is a great feature because it lets you rapidly locate the exact information that you are looking for.
Images by Justin James for TechRepublic
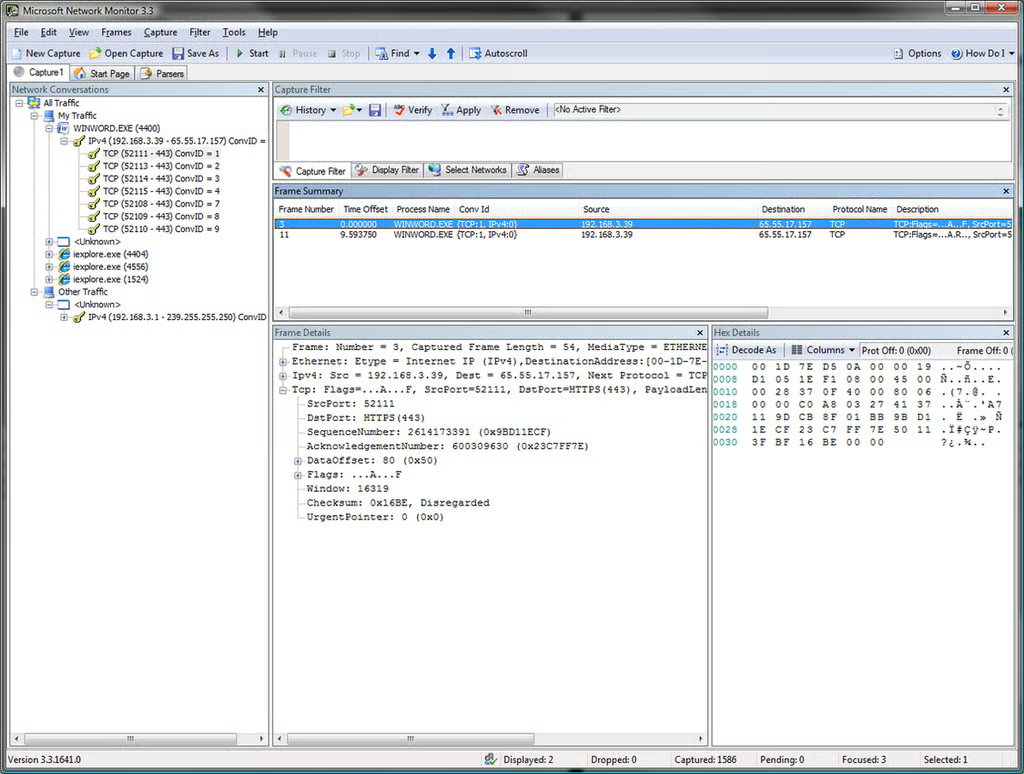
Inspecting HTTPS communications is rather limited, because the data within the conversation (other than the initial headers) is encrypted. If you need to know what is inside SSL transmissions, you will need to use a proxy server of some type.
Images by Justin James for TechRepublic
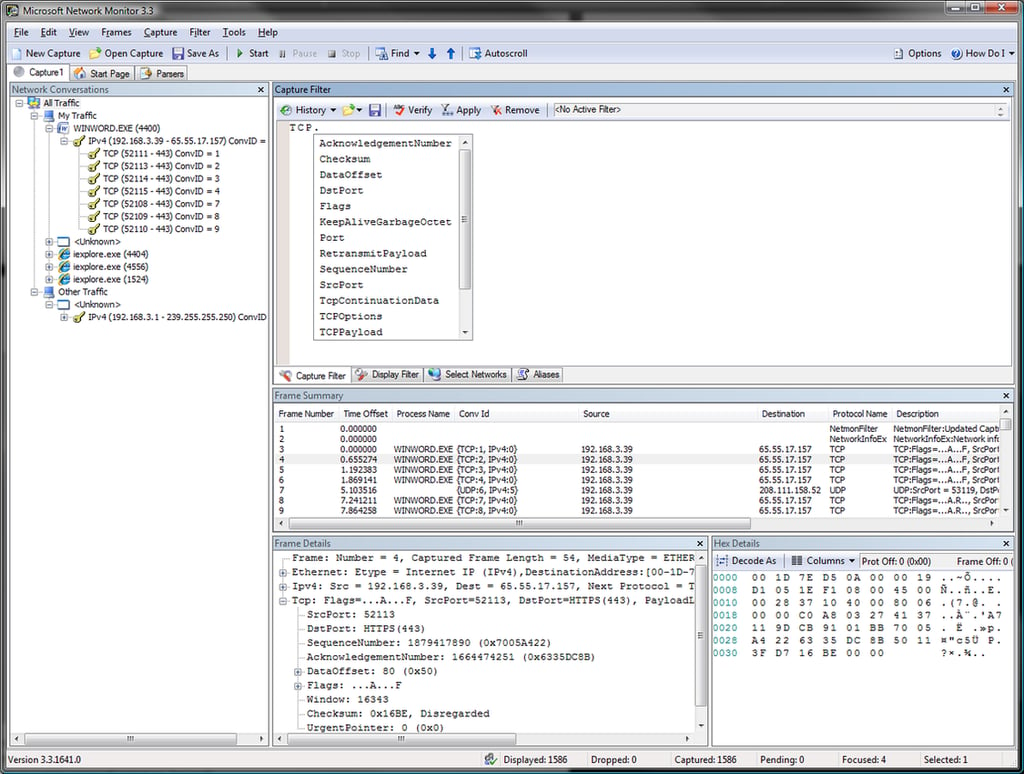
When writing a filter, the UI can pop up a list of available items (similar to many code editors) based on what you have already typed. In this case, we are being shown the items below the TCP group that we can filter on.
Images by Justin James for TechRepublic
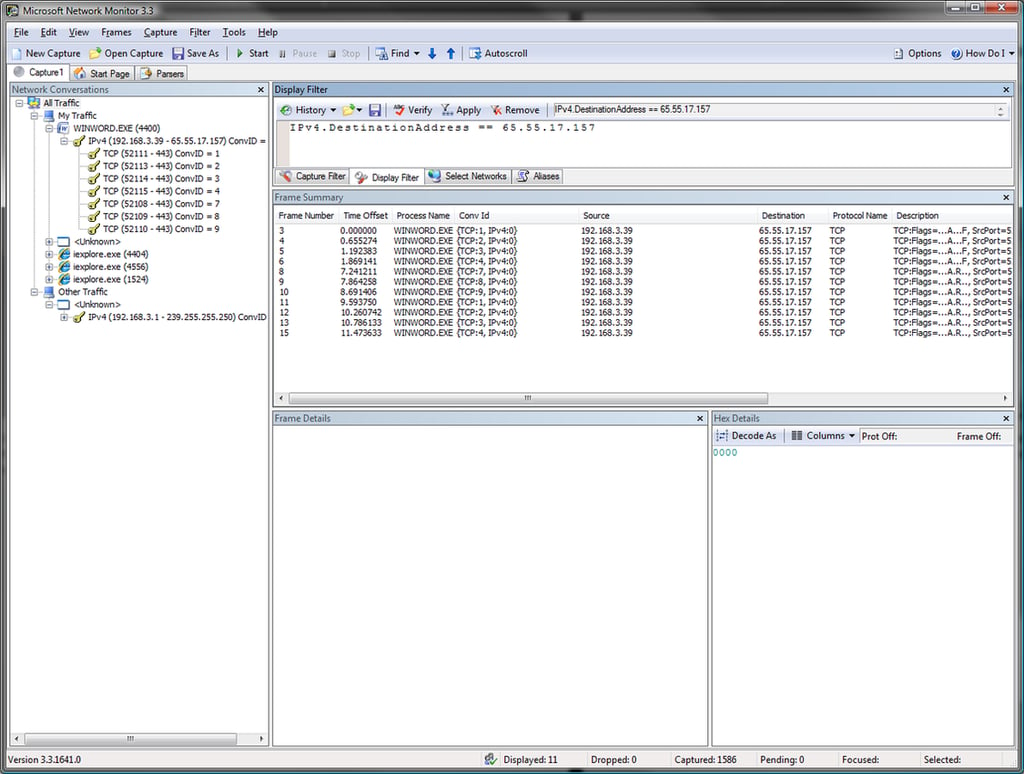
Here, we have applied a filter to show only the items in the currently selected branch of the conversation tree (in this case “All Traffic”) with a specific IP address in the destination. The address filters are flexible, and can filter on source, destination, or both.
Images by Justin James for TechRepublic

Mark W. Kaelin has been writing and editing stories about the information technology industry, software, hardware, gaming, finance, accounting, and technology geekdom for more than 30 years.


