By Ed Bott
Windows Vista doesn’t have to be slow. In fact, most performance problems can be solved by fixing one or two bottlenecks. If you know where to look, that is.
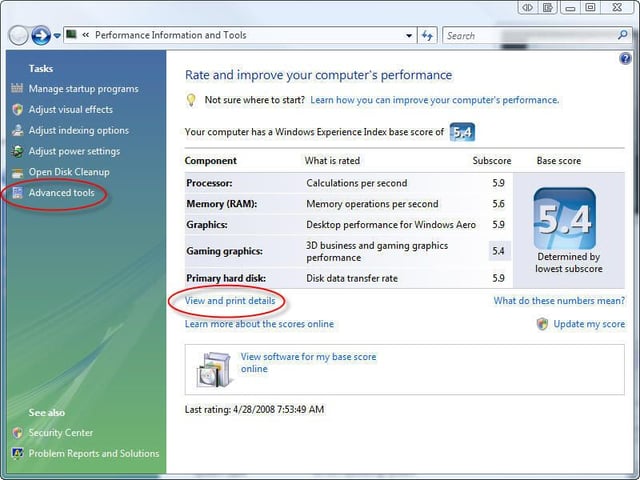
Most Windows tips collections point you to this page but miss the real point. The numeric details shown here won’t help you much, but two obscure links lead to sources of much more useful information. See the next several pages in this walkthrough for details about what you’ll find and how you can use this hidden information.
For a much more detailed discussion of how to use Windows Vista’s built-in utilities to find and fix performance problems, see Fixing Windows Vista, Part 3: Top Troubleshooting Tools.
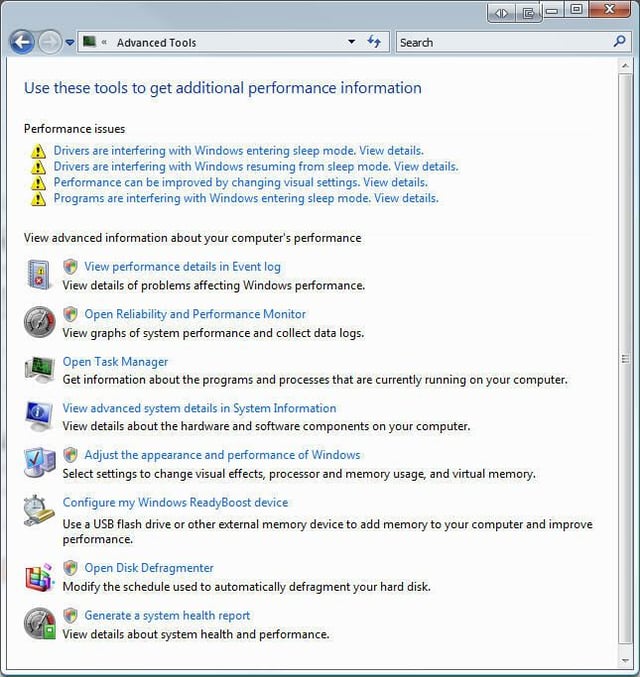
Have you noticed slow startups or shutdowns? Windows Vista monitors what happens and flags possible culprits in the Performance issues section at the top of this page. Each of the four links preceded by a yellow exclamation point leads to a dialog box with more details.
For a much more detailed discussion of how to use Windows Vista’s built-in utilities to find and fix performance problems, see Fixing Windows Vista, Part 3: Top Troubleshooting Tools.
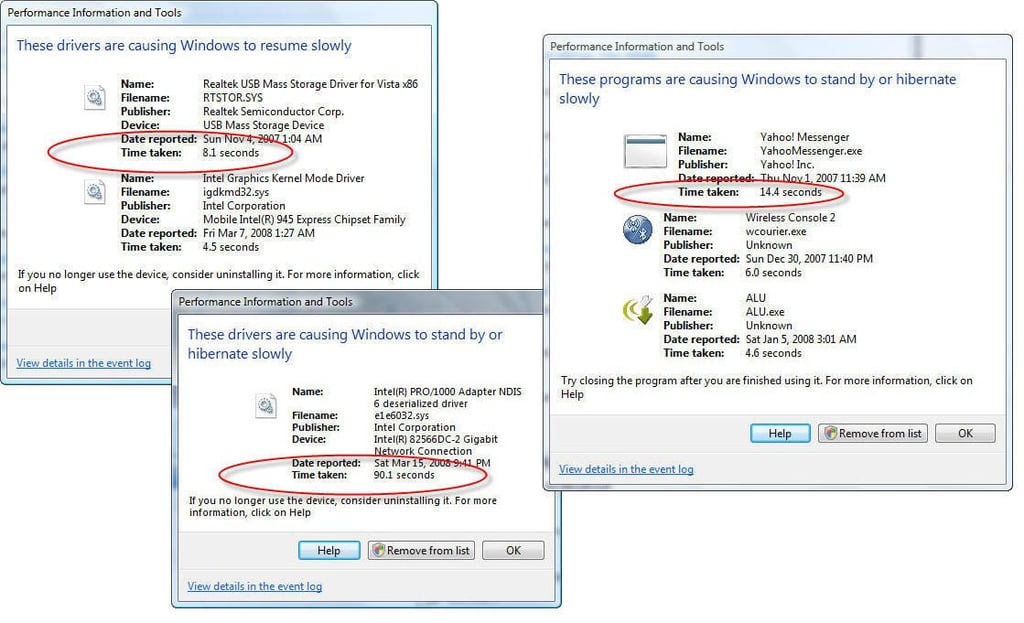
The links on the previous page lead to dialog boxes like the ones shown here. Each entry has enough details to help you track down a problem driver or program and see if there’s a replacement or a settings change that can make things work more smoothly.
For a much more detailed discussion of how to use Windows Vista’s built-in utilities to find and fix performance problems, see Fixing Windows Vista, Part 3: Top Troubleshooting Tools.
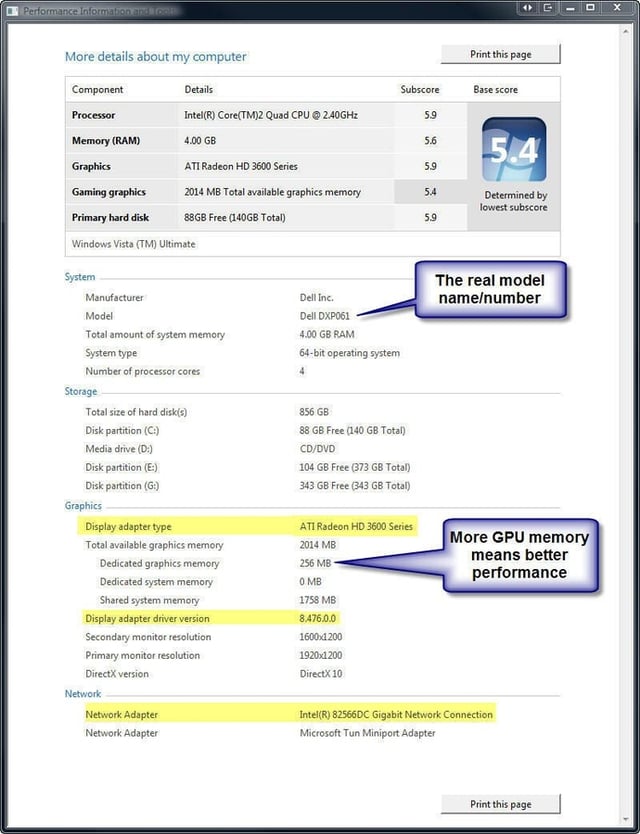
If you click the View and Print Details link under the Windows Experience Index, you’re taken to a page like this one. I’ve highlighted some of the useful details you’ll find here, including model numbers thatyou can use to search for updated drivers.
For a much more detailed discussion of how to use Windows Vista’s built-in utilities to find and fix performance problems, see Fixing Windows Vista, Part 3: Top Troubleshooting Tools.
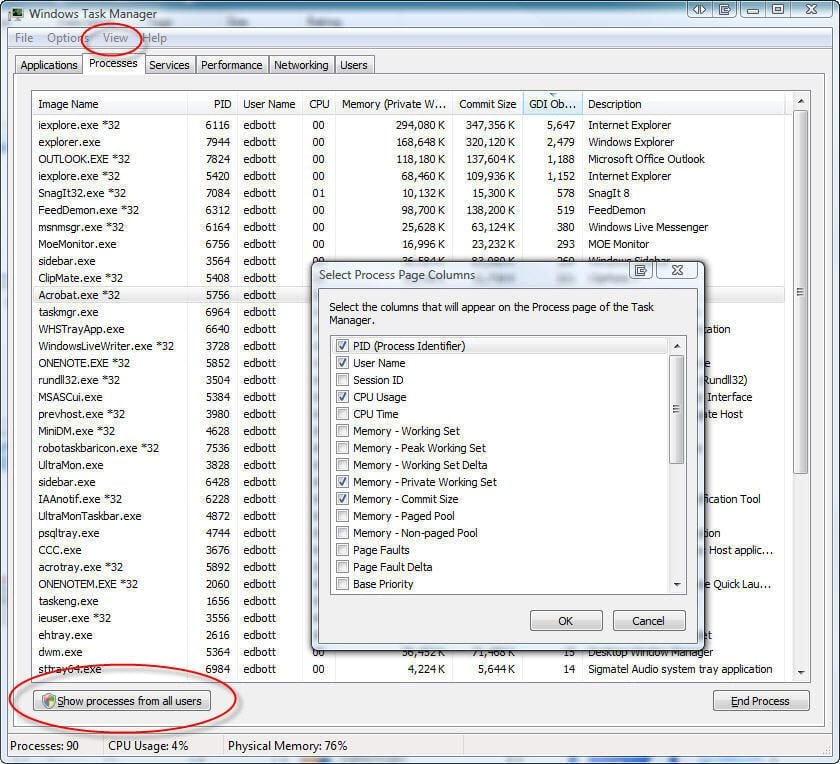
The Processes tab in Task Manager (Ctrl Alt Esc) provides a reasonable amount of information. You can get a wealth of useful details, including the Process Identifier (PID), by clicking View, Select Columns, to open the dialog box shown here. To see all running processes, including those under the system’s control, click the button in the lower left corner.
For a much more detailed discussion of how to use Windows Vista’s built-in utilities to find and fix performance problems, see Fixing Windows Vista, Part 3: Top Troubleshooting Tools.
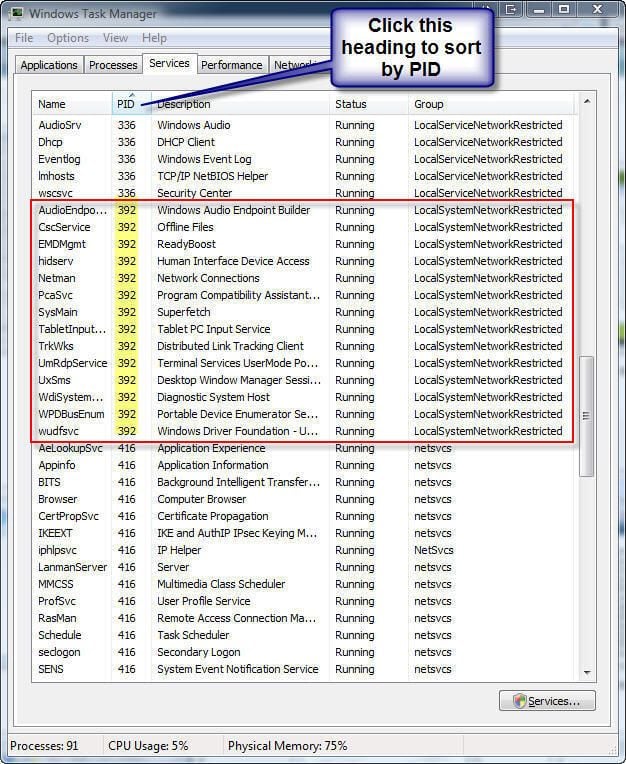
For security and efficiency, Windows Vista groups multiple system services under the same process. If you see an entry on the Processes tab using more CPU then it should, note its PID, go to ths Services tab, and sort by the PID heading to narrow down the list of suspects.
For a much more detailed discussion of how to use Windows Vista’s built-in utilities to find and fix performance problems, see Fixing Windows Vista, Part 3: Top Troubleshooting Tools.
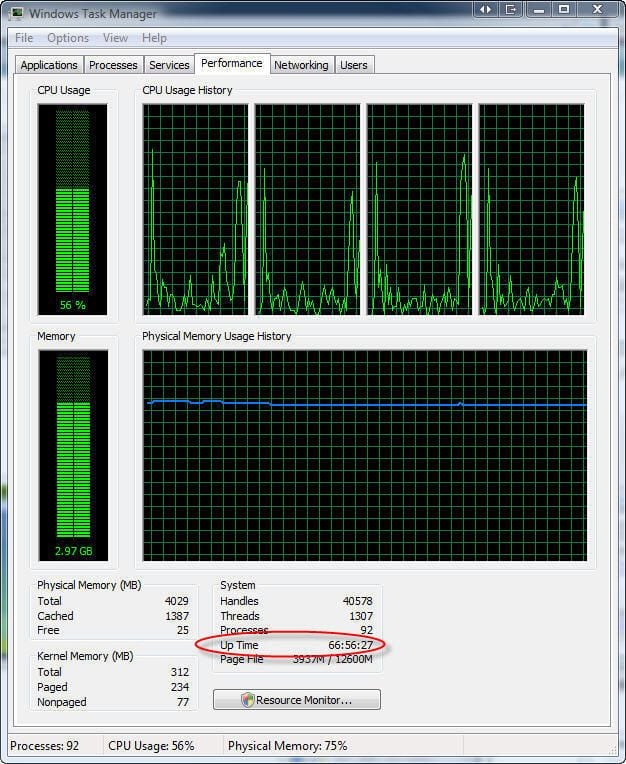
The Performance tab in Task Manager is useful for a quick and dirty snapshot of performance. The set of graphs along the top of the dialog box measure CPU load; the bottom shows physical memory usage. Note the addition in Vista of an easy-to-find Up Time statistic.
For a much more detailed discussion of how to use Windows Vista’s built-in utilities to find and fix performance problems, see Fixing Windows Vista, Part 3: Top Troubleshooting Tools.
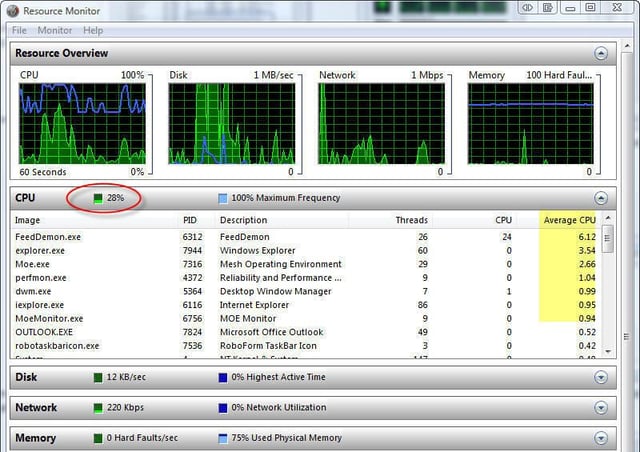
Is your CPU working overtime for no apparent reason? Resource Monitor offers the best way I know to find out which program or service is the culprit. The default sort order uses the last column, Average CPU, as measured over the previous 55 seconds. Watch the CPU column to see whether a program is using little spikes of CPU time or is working nonstop.
For a much more detailed discussion of how to use Windows Vista’s built-in utilities to find and fix performance problems, see Fixing Windows Vista, Part 3: Top Troubleshooting Tools.
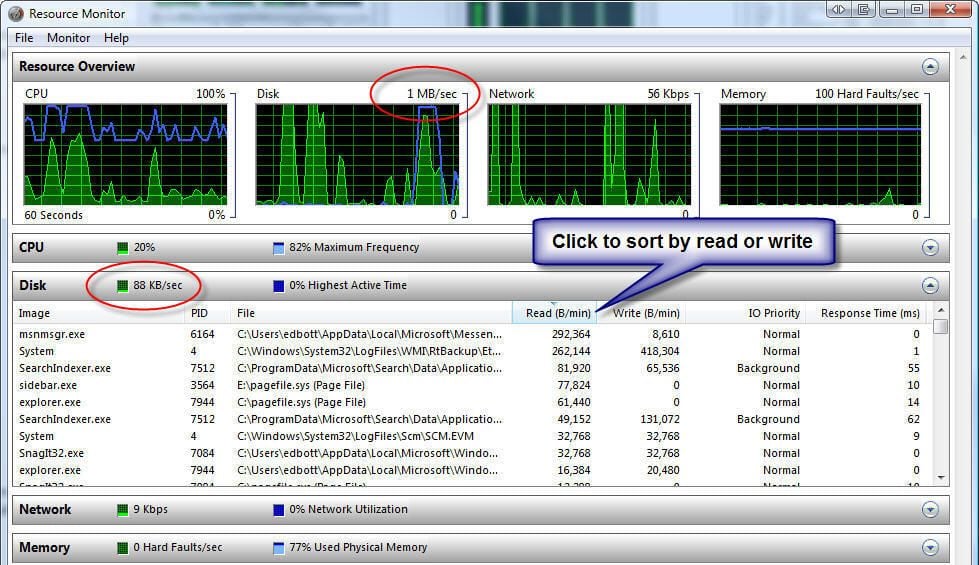
Use the disk information to see which programs are responsible for the most disk activity. Be sure to pay attention to the scale in the graph at the top of the page, which changes as disk activity increases or decreases. Sort by the Read or Write heading to make heavy disk users appear at the top of the list.
For a much more detailed discussion of how to use Windows Vista’s built-in utilities to find and fix performance problems, see Fixing Windows Vista, Part 3: Top Troubleshooting Tools.
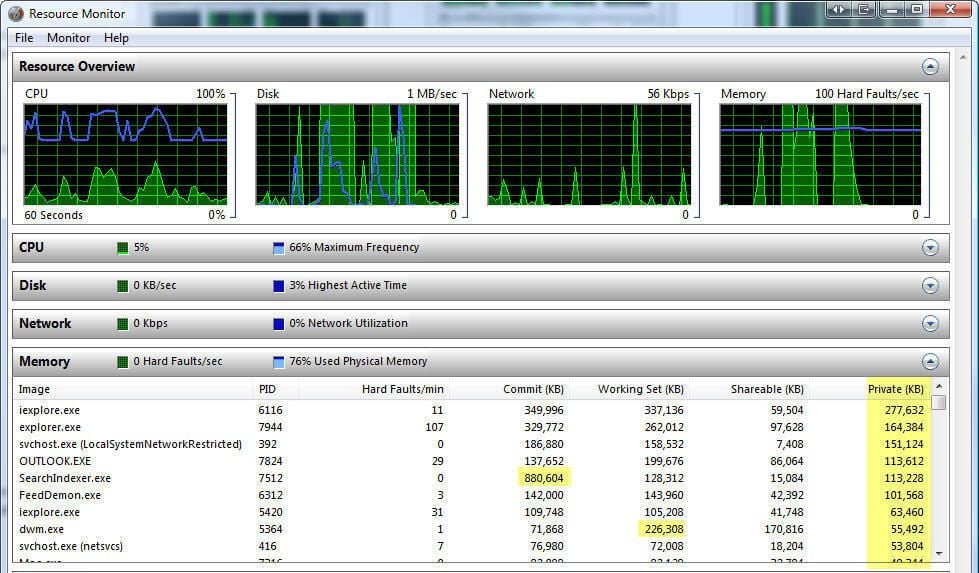
The Memory graph at the top of the age emphasizes hard faults per second. A low number means your cache is working efficiently. The default sort order is the Private Working Set number at right. The Commit value measures pages actually in memory and should add up to physical memory in use.
For a much more detailed discussion of how to use Windows Vista’s built-in utilities to find and fix performance problems, see Fixing Windows Vista, Part 3: Top Troubleshooting Tools.
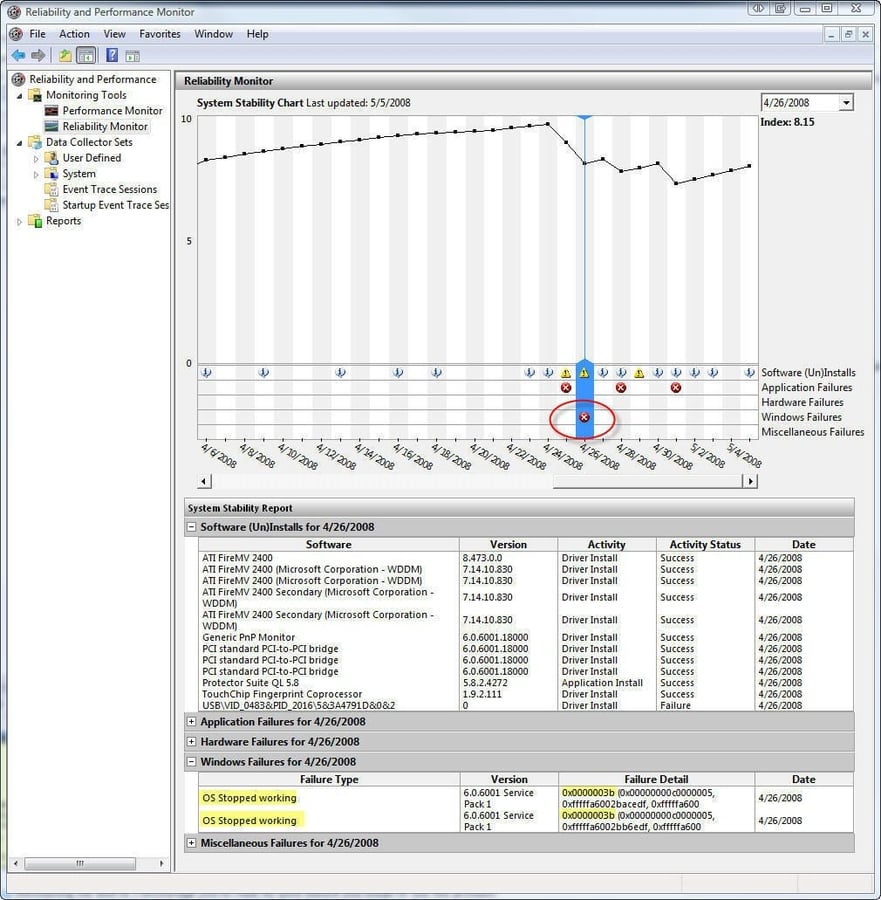
The Reliability Monitor offers a numeric index of your system’s resistance to crashes (10.0 is perfect). Digging into the red X’s and yellow exclamation points can help identify whether problems or transient or persistent. In this case, trying to install an old video driver resulted in blue-screen errors. With he correct driver installed, the problems vanished.
For a much more detailed discussion of how to use Windows Vista’s built-in utilities to find and fix performance problems, see Fixing Windows Vista, Part 3: Top Troubleshooting Tools.


