


Creating graphs is easy — grab your favorite spreadsheet program, enter some data, and use the chart wizard. What’s more difficult is creating those graphs to be published on the web based on dynamic data. Plenty of options are available to graph hard-entered data, but few are capable of dynamic generation.
In this edition of Five Apps, we take a look at five free web-based tools for creating different types of graphs from dynamic data. Each of these apps offers a vast number of options and lots of customizability, more so than I could possibly demonstrate here. So take a look at each webpage and browse through the examples provided to see the power of each of these tools.
Note: This article is also available as an image gallery and a video hosted by TechRepublic columnist Tom Merritt.
1: amCharts
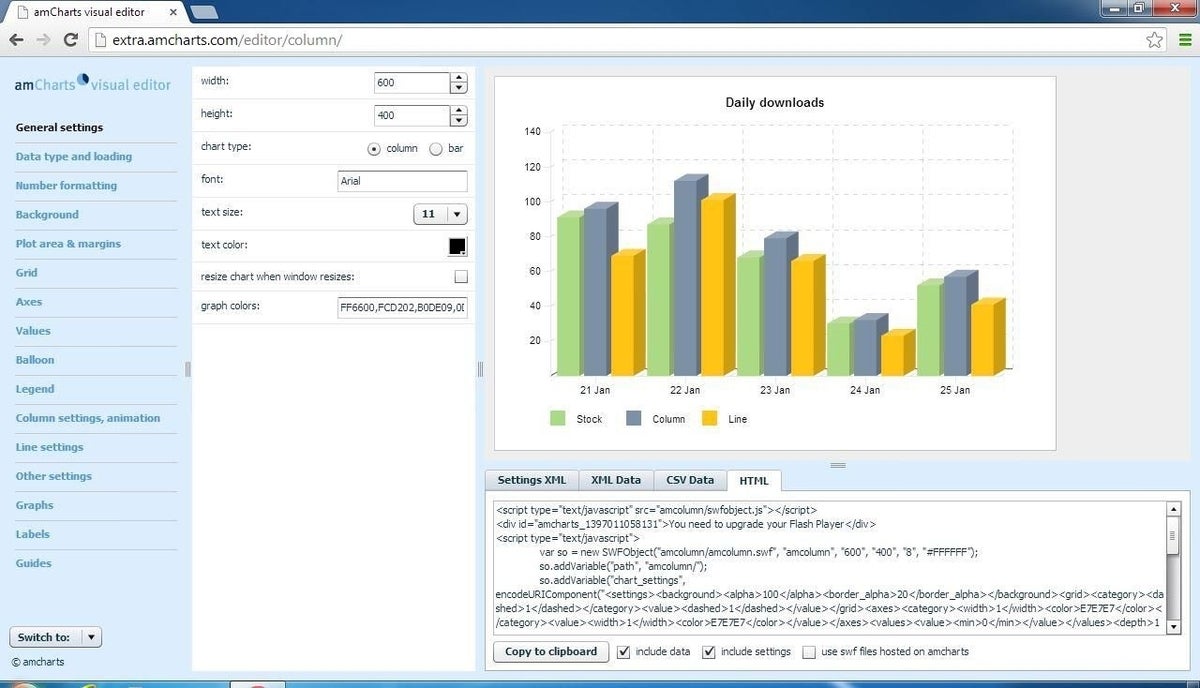
amCharts (Figure A) is perhaps the simplest of the tools on this list. It offers only the basic options for the most common types of charts. However, it comes with a nice visual editor that allows you to paste in sample data in a CSV format (which it then converts to XML) and manipulate the settings all while watching your graph take shape. When you’re finished, simply copy the generated HTML code into your page to display your Flash-based graph. If you want to use dynamic data, replace the value in the “chart_data” variable with a custom-generated XML dataset.
Figure A
2: D3.js
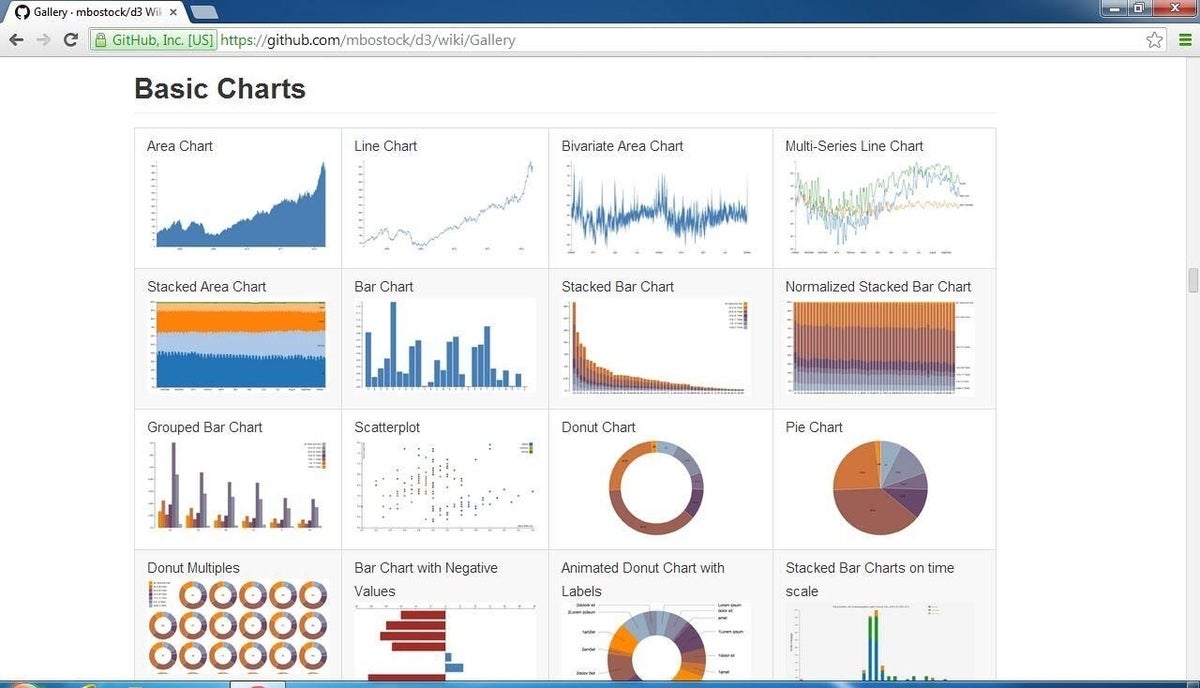
D3.js (Figure B) is not just a graphing application. It’s really a full DOM framework, much like jQuery, that takes the W3C API and makes it much more manageable. This gives you a framework to create nearly any type of visualization. The examples gallery is chock full of basic graph types as well as interactive and animated graphs, a massive array of specialized visualizations, and even a few graphical games. Developing for this framework is a little more involved than the others on this list, but the results can really be worth it.
Figure B
3: Flot
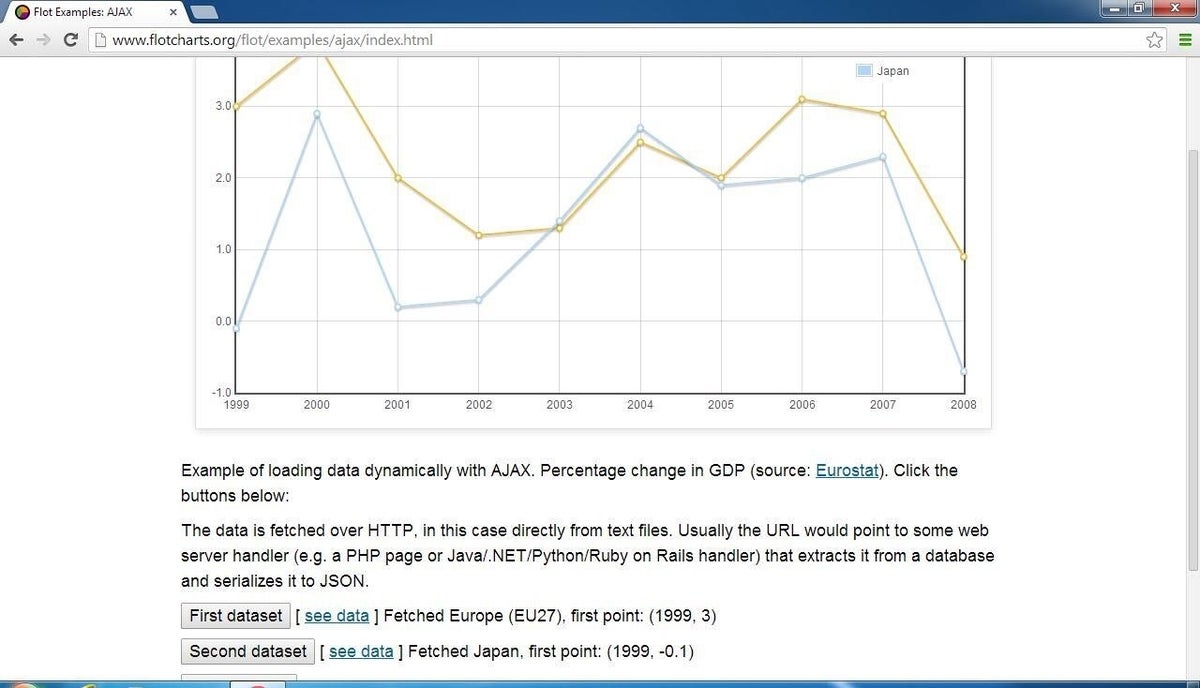
Flot (Figure C) is a simple jQuery-based graphing utility with a massive array of options. It starts with line or scatter charts that can be static or dynamic and that allow you to customize colors, text, and other aspects. Then, you can add in dynamic (dashboard-like) enable/disable of chart series, click-and-drag rectangular zooming, click support, tooltips, panning, and resizing, all via various plugins. The advanced features include custom plot point symbols, axes customization, data thresholding (red light – green light), and more. Ambitious developers can even create their own plugins to share with the community.
Figure C
4: Google Charts
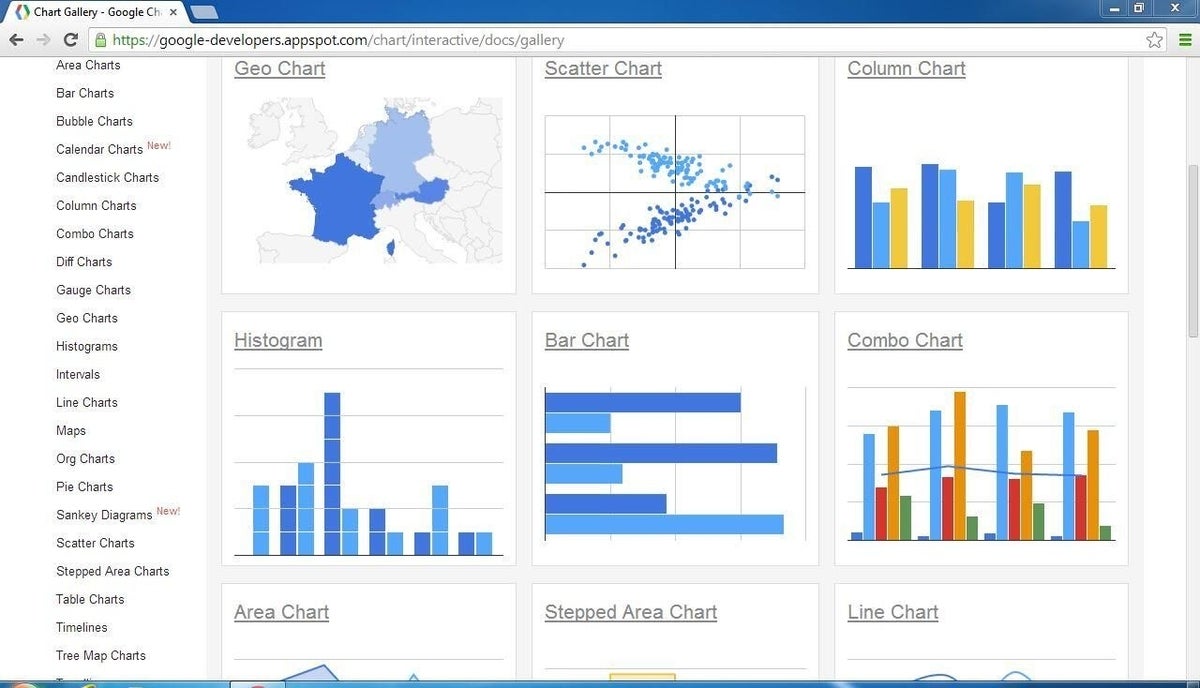
Google Charts (Figure D) is an HTML5-based API offering a variety of chart types — pie, bar, line, tree map, and many others — with a wide array of customizable attributes, including colors, labels, and graphical appearance. Data can be based off a Google Spreadsheet, Google Fusion Table, Salesforce database, or practically any data source that can be queried using AJAX or JSON. The standout feature, though, is the set of dashboard controls. These allow your user to adjust the data being presented by limiting the query using sliders, drop-downs, and other controls. Finally, you can use Google Code Playground to design and build your charts and graphs.
Figure D
5: Highcharts
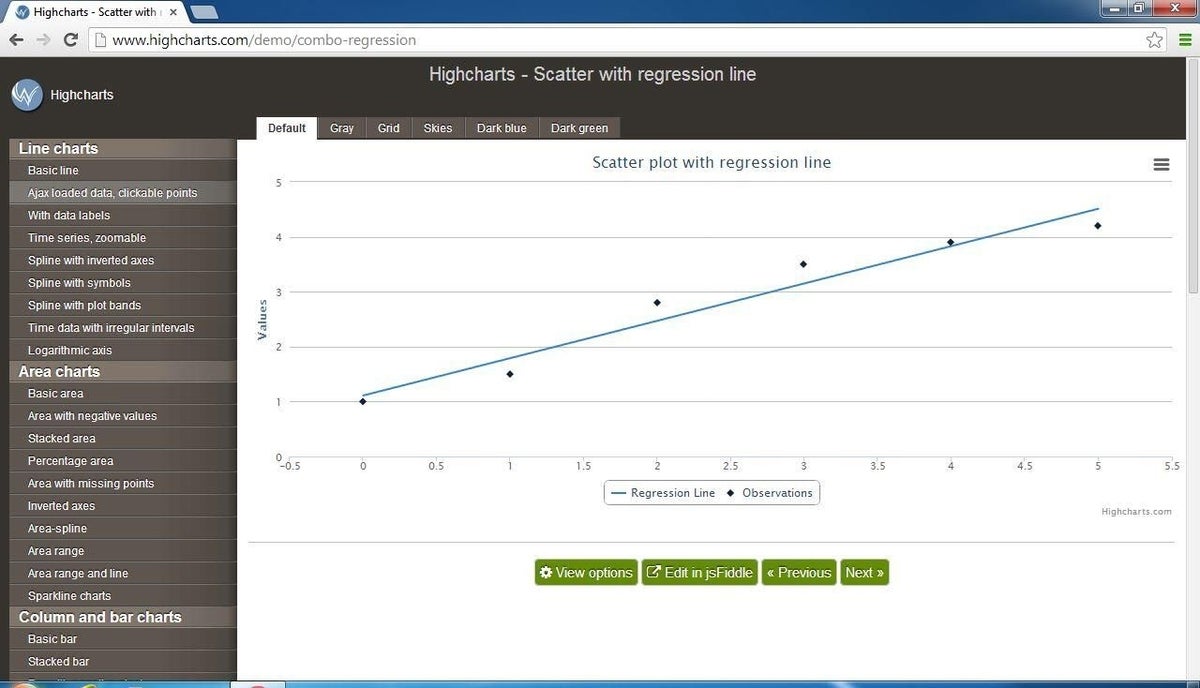
Using HTML5 and JavaScript, Highcharts (Figure E) offers a wide array of charts — basically all the common types as well as a massive array of specialized types. They can be easily populated using JavaScript arrays or another data source via script that writes a JavaScript array. Highcharts is customizable — labels, colors, and text alignment — but its most notable feature is the look and feel. Highcharts has a quality look to it, and the graphs do small animations while being drawn. For high-profile presentations, this could be useful. Highcharts links to JSFiddle for designing and building your charts and graphs.
Figure E
Your picks
What other free web-based graphing apps or tools have you used? Share your thoughts on the ones on this list or other apps in the comments below.