


With Looker dashboards, you can track key performance indicators, monitor trends, spot opportunities, create reports and share insights with your team. If you are looking for how to leverage the powerful visualization capabilities that Looker offers, it is important to learn how to create a dashboard in Looker. In this guide, we’ll cover the step-by-step process of creating a dashboard in Looker.
In Looker, you can create custom dashboards to display the data that is most important to you. You can create Looker dashboards from a folder, Look or Explore.
Jump to:
- Creating a Looker dashboard from a folder
- Creating a Looker dashboard from a Look or Explore
- Types of Looker dashboard tiles
- Visualizing your data your way
Creating a Looker dashboard from a folder
To create a dashboard in Looker from a folder:
- In the Looker interface, navigate to the desired folder you want to create the dashboard (Figure A).
Figure A
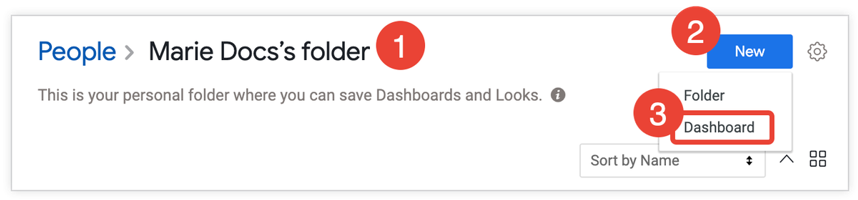
- At the top right of the folder, click New.
- Select Dashboard from the pop-up menu at the top of the screen.
- In the pop-up window, enter a name for your new dashboard (Figure B).
Figure B
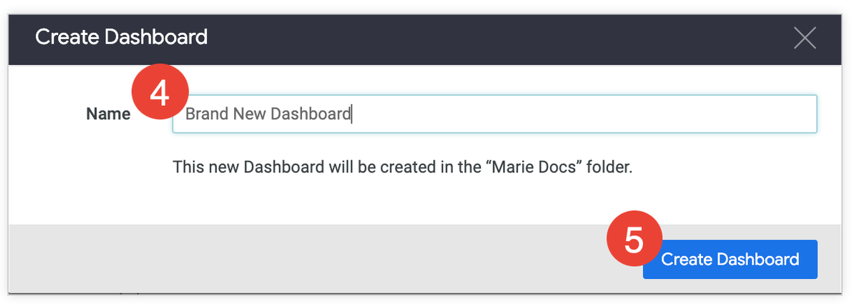
- Then, select the Create Dashboard button.
- Edit the dashboard (Figure C).
Figure C
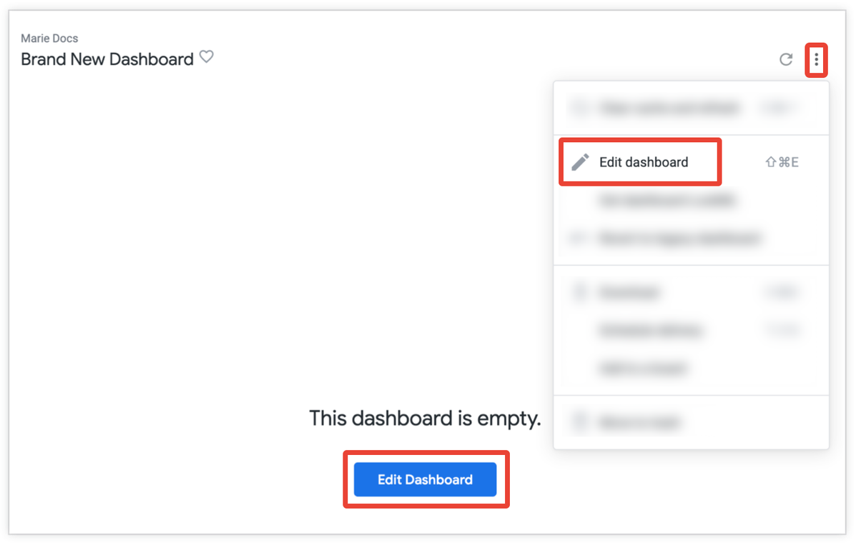
When you first create a dashboard, it will appear blank. To add tiles or text, enter edit mode by clicking the Edit Dashboard button in the center of the dashboard pane or selecting Edit dashboard from the dashboard menu.
SEE: Having trouble with Looker? Explore these other cost-effective data visualization tools.
Creating a Looker dashboard from a Look or Explore
The second method of creating a user-defined dashboard in Looker is via a Look or Explore. The following is the process of setting up a new dashboard:
- Navigate to a Look or Explore.
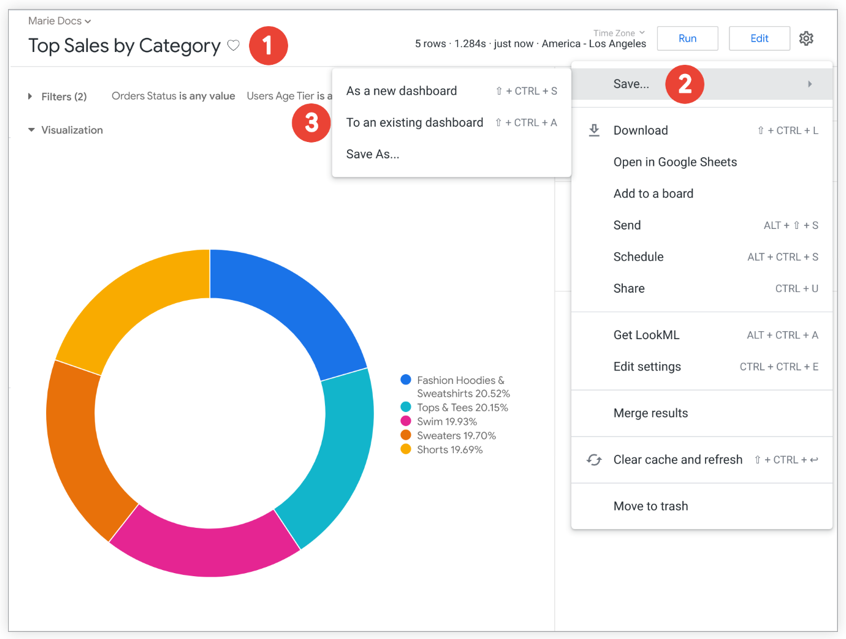
- Once you’re on the Look or Explore page, select Save and a submenu will appear (Figure D).
Figure D
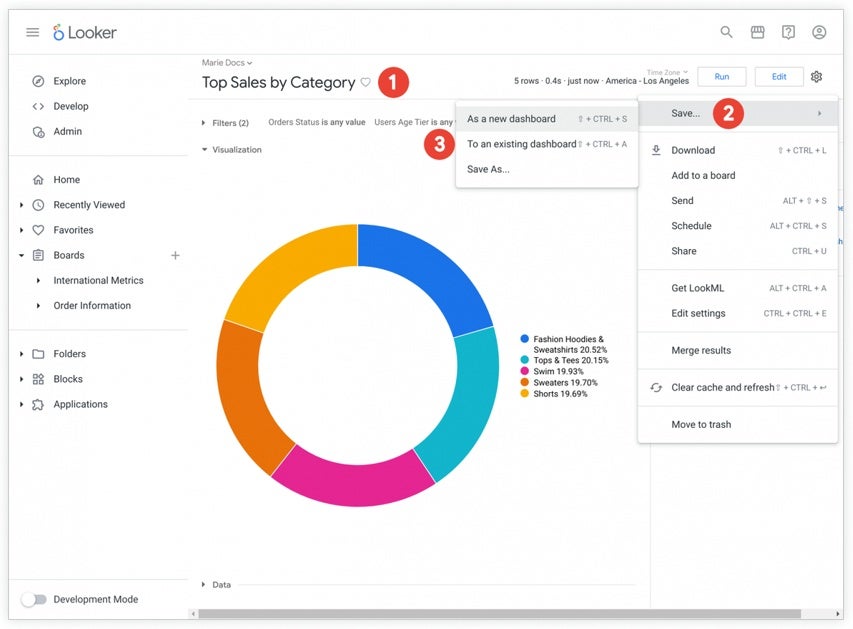
- Then, select As A New Dashboard from the sub-menu. A Save As New Dashboard window will appear.
- Enter a name for your new dashboard under the Settings tab.
- Then, select a folder where you want to save your dashboard. Note that you must have Manage and Edit access for your desired folder.
- You can choose between using the Look filters or the Explore filters for the dashboard on the Filters tab (Figure E). Although there is no way you can use custom filters as dashboard filters, they may still be used on tiles.
Figure E
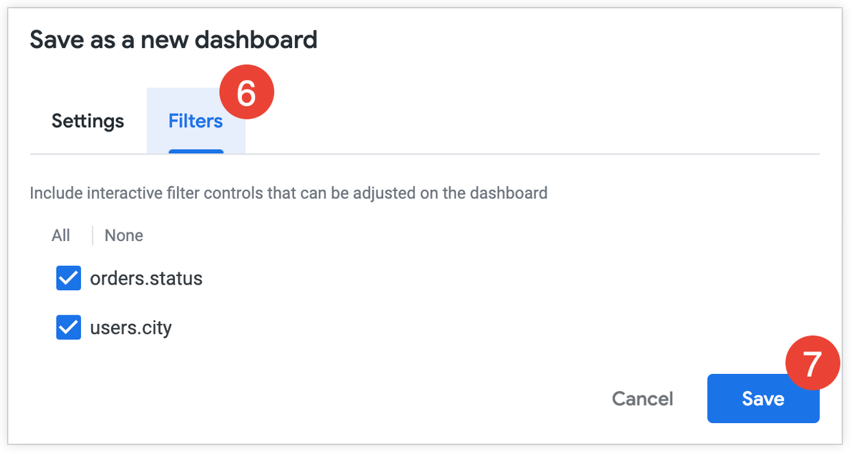
- Finally, select save on the bottom right corner of your screen.
After you’ve created a dashboard, it is usually empty. The next step is to add tiles and text (Figure F). You can do this by creating Query Tiles within the dashboard.
Figure F
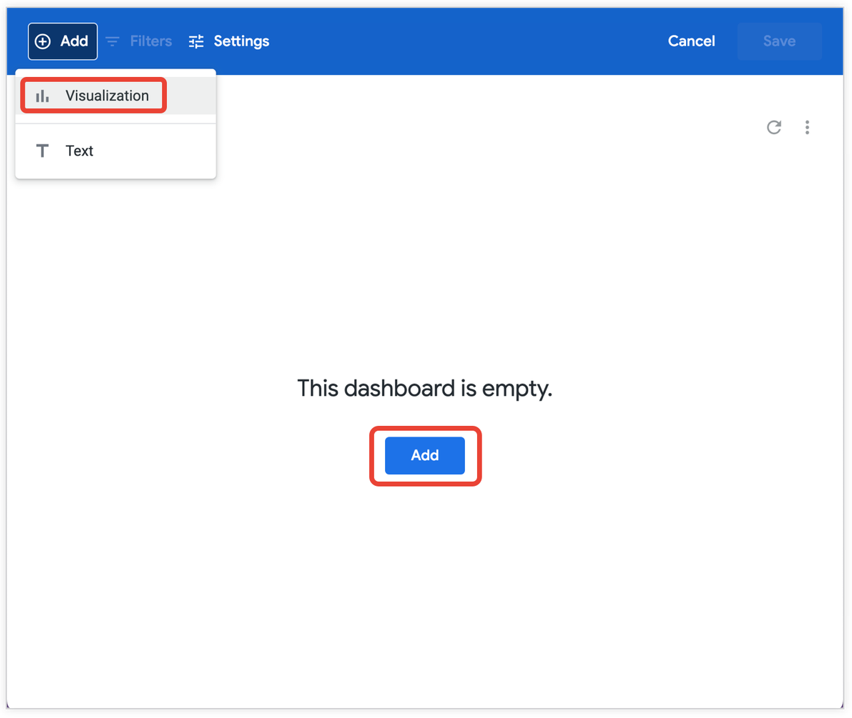
Click the Add button on the top left of the dashboard. Then, select Visualization. A menu with several Looker Explores will appear. Select one to create your Query Tile.
Types of Looker dashboard tiles
There are three types of tiles you can use to build your dashboard.
Must-read big data coverage
- What Powers Your Databases? Take This DZone Survey Today!
- New AI Data ‘Universal Translator’ From Salesforce, Snowflake, Others
- Top Tech Conferences & Events to Add to Your Calendar in 2025
- Google Releases Data Commons MCP Server to Supercharge AI Agents
Query Tiles
Query Tiles can be created in-dashboard or added to a dashboard from a Look or Explore. Unlike regular Looker searches, a Query Tile only appears on Looker Dashboards. If you don’t want to fill up your folders with too many Looks, Query Tiles can help you out. Even if the Look is erased, the tile remains on the dashboard and is unaffected by further modifications to the Look.
To add a Query Tile:
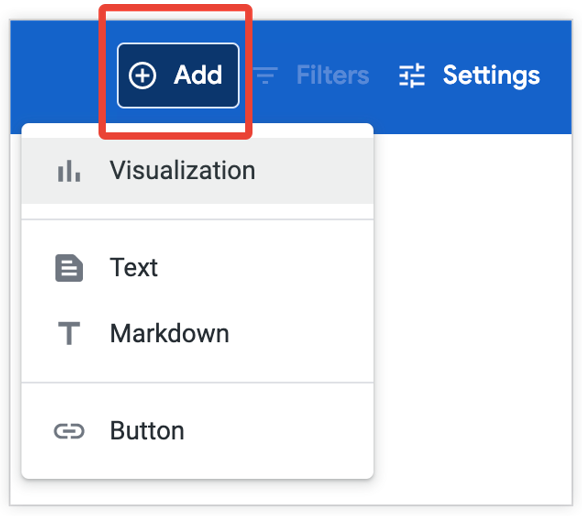
- In the dashboard’s edit mode, click Add | Visualization.
- From the menu that pops up, choose an Explore.
- Build out your query from the Explore window, then give it a name (Figure G).
Figure G
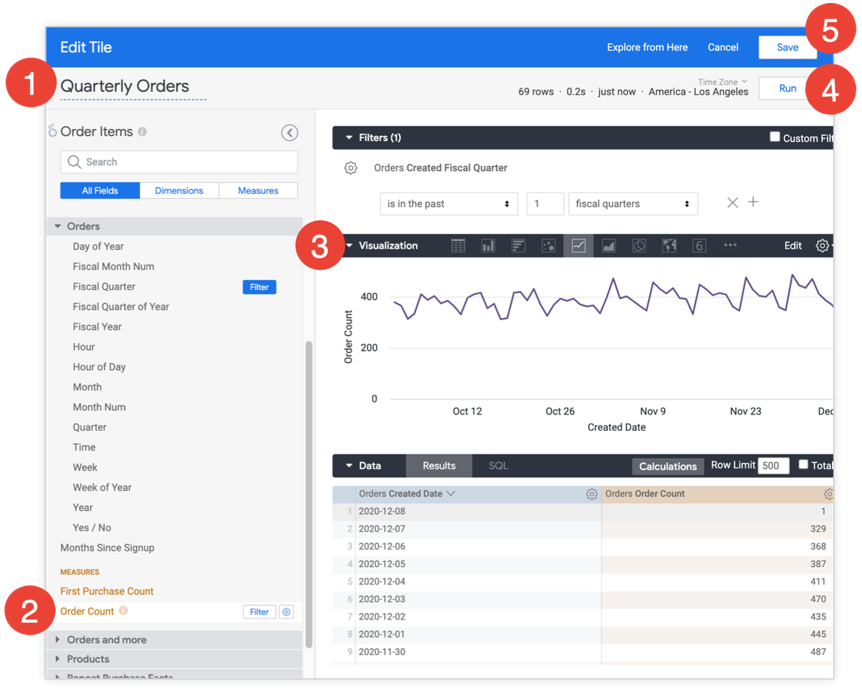
- Next, you’ll need to make adjustments to any fields, filters or visualization preferences.
- Once you’re done, click Run.
- To add the Query as a tile to your dashboard, simply click the Save button.
Look-Linked Tiles
A Look-Linked Tile is a good option if you want to build, modify and test a query in one location but use it in many dashboards. Any associated tiles will also be updated if the Look is altered. You can only add a Look-Linked Tile to a dashboard from a Look. They connect the underlying query of a Tile to a Look.
To add a Look-Linked Tile to your Looker dashboard:
- Ensure the Look is in the same folder as the dashboard. This may mean you need to copy the Look into the dashboard’s folder.
- From the submenu, select To an existing dashboard (Figure H).
Figure H
- In the Add to Dashboard window, make sure the folder with the Look and dashboard is selected (Figure I).
Figure I
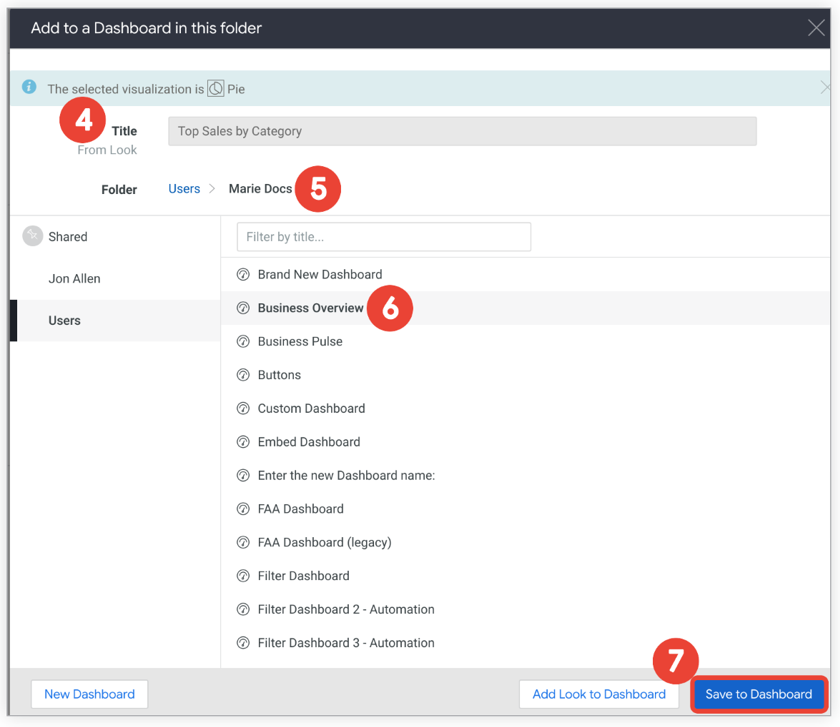
- Select the dashboard, and click Add Look to Dashboard.
Text Tiles
Text Tiles specify and label the various graphical components of Looker dashboards. They are formatted to resemble headlines and descriptions rather than Tiles and have a basic style that allows for a wide range of customization options. To add a Text Tile to a Looker dashboard:
- From the dashboard’s edit mode, click Add, and then choose either Text or Markdown (Figure J). Text editing is for visual editing, and Markdown is for HTML editing.
Figure J
- Add buttons (Figure K). This button can be linked to a Looker URL or external page.
Figure K
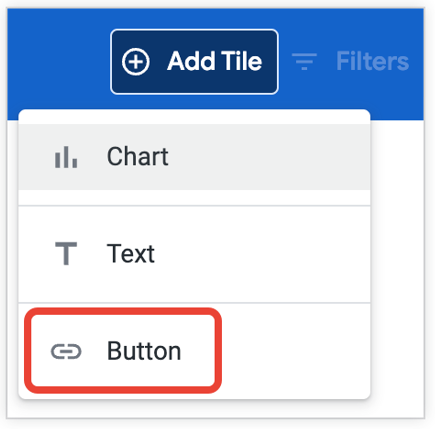
When adding a button, ensure your dashboard is in edit mode. When you select the button from the menu, a button dashboard will appear prompting you to add the button label, link and description. You can also choose to configure the button to open the link in a new browser tab or the same tab when clicked.
Visualizing your data your way
Dashboards are a visual representation of the data we use daily and help us focus on what is most important. Looker dashboards are easy to create for both technical and business users. We have simplified the process in this guide to enable you to make informed business decisions and track performance over time.
Not sure if Looker is the right tool for your business? Explore these other top data visualization tools.