


Image: Profit_Image/Shutterstock
Elasticsearch is a very powerful search and analysis engine that can scale extremely well. With this tool, you have the foundation for visualizing massive amounts of data. But when you start to scale Elasticsearch to meet the demands of big data, you’re going to want to employ more than one server. When you start to scale up to meet enterprise demands, a single server would choke on that amount of data.
More about data centers
- Stargate Norway: OpenAI’s First AI Data Center in Europe
- AI Data Centers’ Soaring Energy Use: Who Pays for Higher Utilities Costs?
- China’s Submerged AI Data Center Could ‘Influence Global Sustainable Computing’
- Google to Power Data Centers With Nuclear Energy by 2030 in First-Of-A-Kind’ Agreement
So, what do you do? You deploy a cluster of Elasticsearch servers. I’m going to show you how to do just that. When you’re finished, you’ll have the necessary power to start building incredible data visualization tools, capable of handling massive amounts of data.
SEE: Snowflake data warehouse platform: A cheat sheet (free PDF) (TechRepublic)
What you’ll need
I’m going to demonstrate this on two instances of Ubuntu Server 20.04, but you can roll it out to as large a cluster as you need. Besides the two instances of Ubuntu Server, you’ll also need a user with sudo privileges. That’s it. Let’s deploy.
How to install Java
You’re going to need at least Java 8 installed on every server, so we’re going to install the default JRE with the command:
sudo apt-get install default-jre -y
Once that’s installed on both of our test machines, we can then install Elasticsearch.
How to install Elasticsearch
This has to be done on both machines. First, install the Elasticsearch GPG key:
wget -qO - https://artifacts.elastic.co/GPG-KEY-elasticsearch | sudo apt-key add -
Next, install apt-transport-https with:
sudo apt-get install apt-transport-https
Add the necessary repository with the command:
echo "deb https://artifacts.elastic.co/packages/6.x/apt stable main" | sudo tee -a /etc/apt/sources.list.d/elastic-6.x.list
Finally, update apt and install Elasticsearch:
sudo apt-get update

sudo apt-get install elasticsearch -y
Start and enable Elasticsearch:
sudo systemctl start elasticsearch

sudo systemctl enable elasticsearch
How to configure Elasticsearch
You’ll do this on both servers, just make sure to alter the configuration to fit each machine. We’ll call the first machine controller-1 and the second machine node-1. Open the configuration file with the command:
sudo nano /etc/elasticsearch/elasticsearch.yml
In that file, you’ll want to edit the following lines. Some of these lines will be commented out, so you’ll need to remove the leading # character first. The lines to be edited are (everything in bold should be edited as needed):
- cluster.name: elkcluster
- node.name: “controller-1“
- network.host: 192.168.1.80
- http.port: 9200
- discovery.zen.ping.unicast.hosts: [“192.168.1.80“, “192.168.1.81“]
In my case, the controller is on 192.168.1.80 and the node is on 192.168.1.81.
Save and close the file. Restart Elasticsearch on both machines:
sudo systemctl restart elasticsearch
How to test the cluster
You’ll need to give Elasticsearch a few minutes to come up. You can test it with the command:
curl -XGET 'http://192.168.1.80:9200/_cluster/state?pretty'
Make sure to edit the IP address above to either your controller or node. If you’re testing the controller, use the controller IP, and if you’re testing the node, use the node IP.
When Elasticsearch is finally running, you should see quite a lot of output that includes:
{
"cluster_name" : "monkeypantz",
"cluster_uuid" : "rGzNNmm_Rteel0Xg3xqw9w",
"version" : 6,
"state_uuid" : "WVx5O6Q7SfOqZf_wxaPOKQ",
"master_node" : "2NI9_pDYS1WvJYQz-XY3KQ",
"blocks" : { },
"nodes" : {
"yV2TBoxVTvKbh7E1ZngpbA" : {
"name" : "node-1",
"ephemeral_id" : "pkb3vapLTd2yFLrXO64ENA",
"transport_address" : "192.168.1.81:9300",
"attributes" : {
"ml.machine_memory" : "3137888256",
"ml.max_open_jobs" : "20",
"xpack.installed" : "true",
"ml.enabled" : "true"
}
},
Once both the controller and the node are up and running, test the cluster with the command:
curl -XGET '192.168.1.80:9200/_cluster/health?pretty'
Make sure to edit the IP address to match the IP address of the machine you’re running the command on. The output should include:
{
"cluster_name" : "monkeypantz",
"status" : "green",
"timed_out" : false,
"number_of_nodes" : 2,
"number_of_data_nodes" : 2,
"active_primary_shards" : 0,
"active_shards" : 0,
"relocating_shards" : 0,
"initializing_shards" : 0,
"unassigned_shards" : 0,
"delayed_unassigned_shards" : 0,
"number_of_pending_tasks" : 0,
"number_of_in_flight_fetch" : 0,
"task_max_waiting_in_queue_millis" : 0,
"active_shards_percent_as_number" : 100.0
}
The important lines to note are:
"status" : "green",
"timed_out" : false,
"number_of_nodes" : 2,
"number_of_data_nodes" : 2,
You can also check nodes from the controller with the command (run on the controller):
curl -XGET '192.168.1.81:9200/_nodes/?pretty
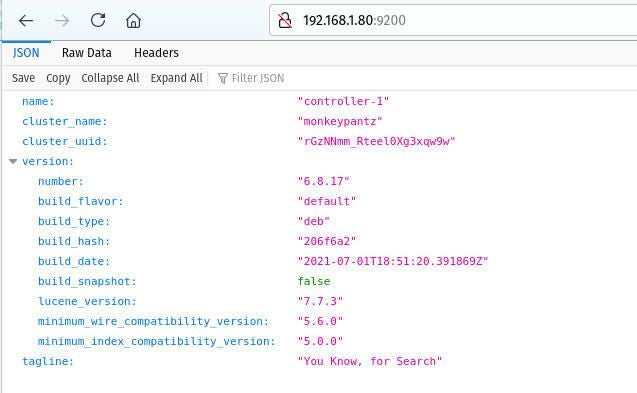
Make sure to substitute the above IP address for that of your Elasticsearch node. You can also point a browser to http://SERVER:9200 (Where SERVER is the IP address of your controller) and you should see output similar to that in Figure A.
Figure A
Congratulations, you now have an Elasticsearch cluster up and running and ready for your developers to use for data visualization.