As a data center admin, one of your jobs is keeping tabs and managing the servers that help power your business. To do that properly, you need tools. No matter if your servers are of the Linux or Windows sort, there are tons of available options. One such option is OpManager, from ManageEngine. This particular take on the server monitor/manager offers plenty of features, such as:
-
Support for physical and virtual Linux servers
-
Alarms, notifications, and alerts
-
Custom dashboards
-
Auto device and system discovery
-
Hardware monitoring
-
3D visualization
-
Support for fail-over and high-availability
Although OpManager isn’t free, you can kick the tires with a 30-day free trial. If the tool winds up being a favorite of yours, you can request a quote from ManageEngine.
Before you get to the requesting of a quote, you’re going to want to know how to get this tool up and running.
Let me show you how.
SEE: MSP best practices: Server deployment checklist (TechRepublic Premium)
What you’ll need
I’ll be demonstrating the installation on Ubuntu Server 20.04, but the tool can be deployed on nearly any Linux distribution or Windows Server. Outside of having a running instance of Linux, you’ll also need a user with sudo privileges.
How to download and install OpManager
The installation of OpManager is actually quite easy. To do so, you must first download the binary installer file. Log on to your Linux server and issue the command:
wget https://www.manageengine.com/network-monitoring/29809517/ManageEngine_OpManager_64bit.bin
Once the file has downloaded, you’ll need to give it executable permissions with the command:
chmod u+x ManageEngine_OpManager_64bit.bin
With the permissions set, run the installer with the command:
sudo ./ManageEngine_OpManager_64bit.bin
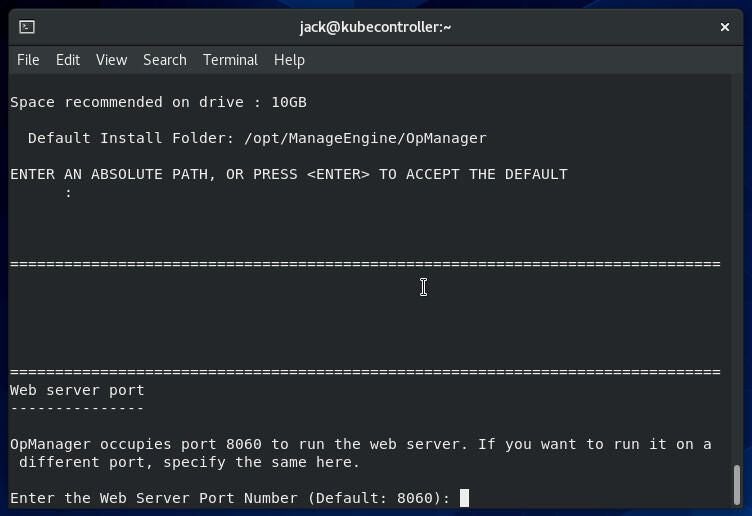
Since we’re working with a GUI-less server, you’ll be greeted by the text-based installer. It’s quite easy to use. In fact, after going through the EULA, accept the defaults for each question (Figure A).
Figure A

The one default you might want to consider opting out of is the default port, which is 8060. If that port is already in use, you will need to change it–otherwise, leave it as-is.
When you’ve accepted all of the defaults, the installation will begin and take roughly two to five minutes, depending on the speed of your network connection. When the installation completes, you’ll be handed the terminal back.
How to start OpManager
This is where the bulk of your time will be spent. The first time you start OpManager, it takes a while to complete.
Back at your terminal window, change to the OpManager bin directory with the command:
cd /opt/ManageEngine/OpManager/bin
In that directory, issue the command:
sudo ./StartOpManagerServer.sh
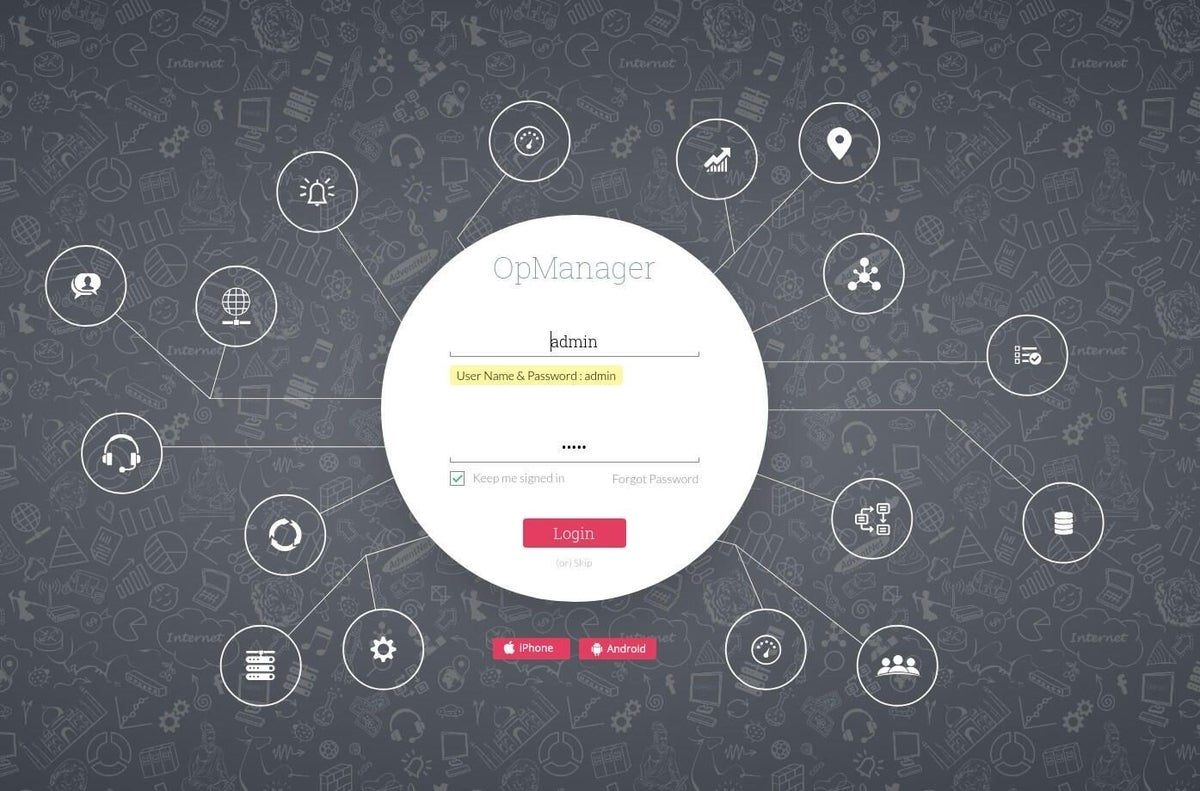
The completion of this task will take up to five minutes. When startup is complete, it will present you with the address and port used to connect to OpManager, which should be in the form http://SERVER_IP:8060 (where SERVER_IP is the IP address of the hosting server). Point a web browser to that address and log in to OpManager with username admin and password admin (Figure B).
Figure B

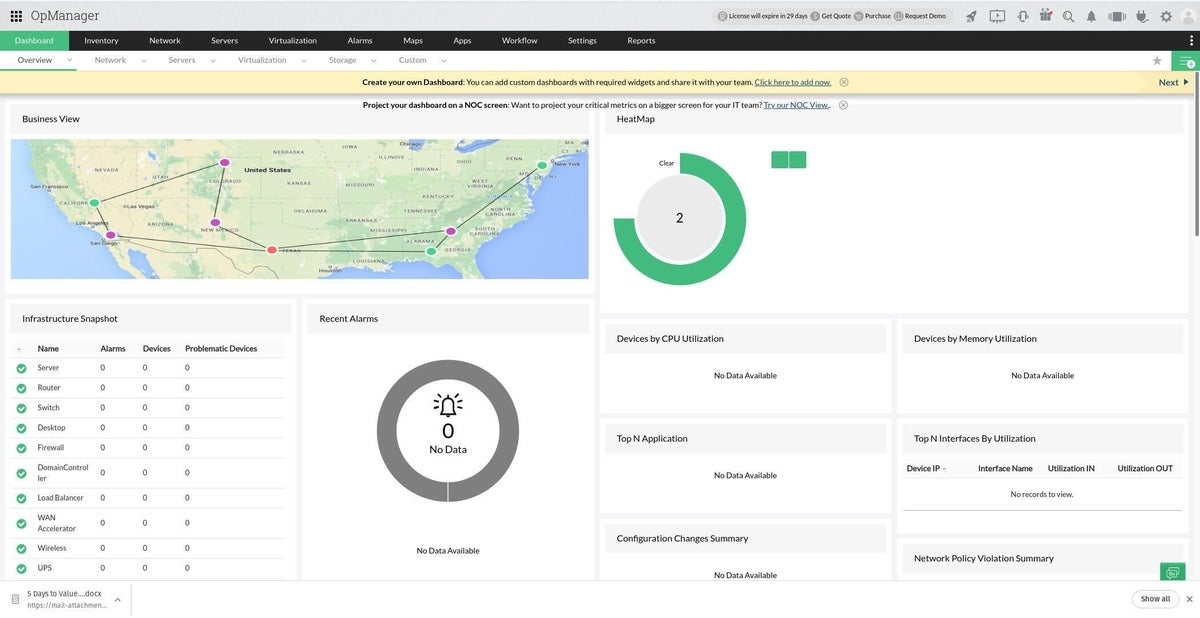
You should find yourself on the OpManager main window, where you can start working with the tool (Figure C).
Figure C

How to start OpManager as a service
Once you have OpManager running, you’ll want to shut down the running instance and set it up to run as a service. Back at the terminal window, kill the running process with the Ctrl+c keyboard shortcut and then issue the command:
sudo ./linkAsService.sh
This will create a systemd startup file, so you can then control OpManager with the commands:
sudo systemctl start OpManager

sudo systemctl stop OpManager

sudo systemctl enable OpManager
Once the service has started, you can log back in to the OpManager dashboard and you’re good to go.
Subscribe to TechRepublic’s How To Make Tech Work on YouTube for all the latest tech advice for business pros from Jack Wallen.

Image: iStockphoto/EvgeniyShkolenko