


Models help us understand–and predict–behaviors of systems. A budget model predicts how advertising and staffing investments result in sales. A network bandwidth model shows how increased use of mobile devices and video impacts traffic.
Cloud: Must-read coverage
- CrowdStrike Outage Disrupts Microsoft Systems Worldwide
- Quick Glossary: Cloud Platform Services
- Achieving Cost Efficiency in Cloud Storage: The Role of Western Digital’s Hard Drive Portfolio
- Still Not Backing Up Microsoft 365 Data? Here’s Why That’s a Risky Move
- Verito vs. Rightworks: Which IT Provider Is Best for Your Firm?
Unfortunately, many models exist only in spreadsheets. And most spreadsheets hide assumptions, logic, and relationships–as anyone who’s had to modify another person’s spreadsheet knows. Key elements of a model hide inside equations in spreadsheet cells.
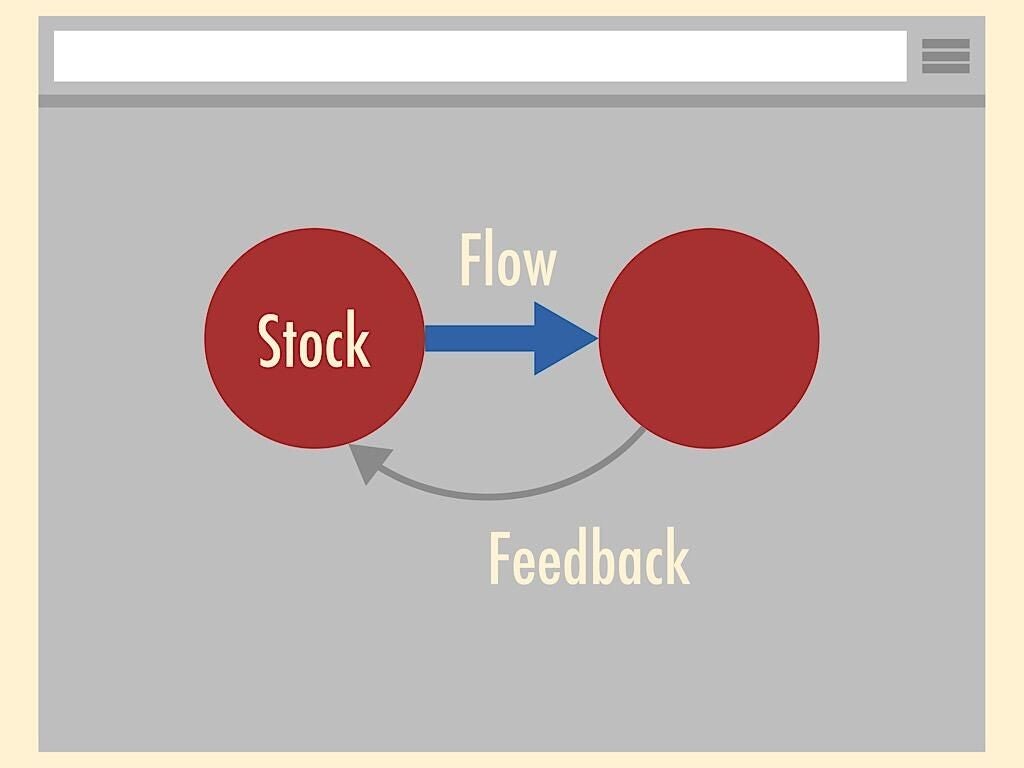
A systems thinking tool makes each element and relationship visible. For example, draw two circles, label each, then draw a line with an arrow between them: With a glance you know that the model includes two items. Thanks to the arrow, you have at least some idea how one influences the other. The visual nature of a systems model may make it easier for people to see how various aspects of a system interact.
Systems modeling software historically has been complex and run locally. When I used iThink and Vensim in the 1990s, the programs were powerful modeling tools. Today, both applications still require installation.
The following three tools all let you build system models in a browser (…which means you can use them on a Chromebook!), but each app offers distinct features.
SEE: Rapid Prototyping for Entrepreneurs (TechRepublic Academy)
LOOPY
I think of LOOPY (by @ncasenmare) as a systems modeling sketch tool: It’s fast, free, and easy to use. It’s the tool to reach for when you’re just starting to build a model. LOOPY lets you capture key elements quickly: Draw circles and lines, then indicate how the output affects another item. When you’re ready to run your model, press Play and choose whether to increase or decrease the quantity in one of the circles to start the cycle. Little arrows pointing up or down move through your model.
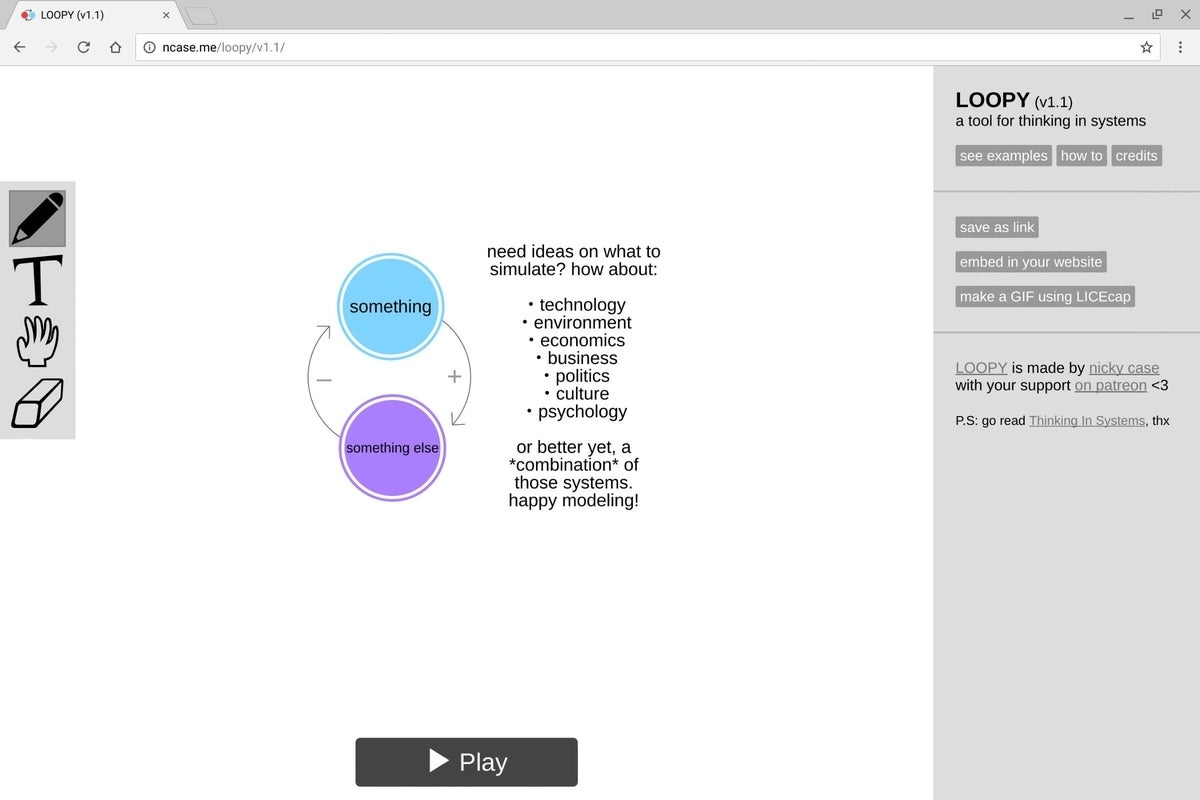
LOOPY can’t do complex calculations and deliver precise predictions. It’s not the tool you need to run sophisticated business or engineering simulations, but it’s a great tool to start a conversation about a complex system with a team. And after you’ve created your model, share the link or embed the model elsewhere on the web.
Sysdea
Sysdea (from @StrategyDynamic) provides a web-native way to model systems with stocks and flows. A “stock” in this case is something that holds a quantity or value, and a “flow” describes an increase or decrease over time. For example, if you have a limited mobile data plan, you start the month with a “stock” of data, which decreases at a variable “flow” rate (e.g., slower as you browse text, faster as you watch a video). Sysdea also supports feedback loops, functions, and variables. Combined, the tools let you build a sophisticated visual model with calculations.
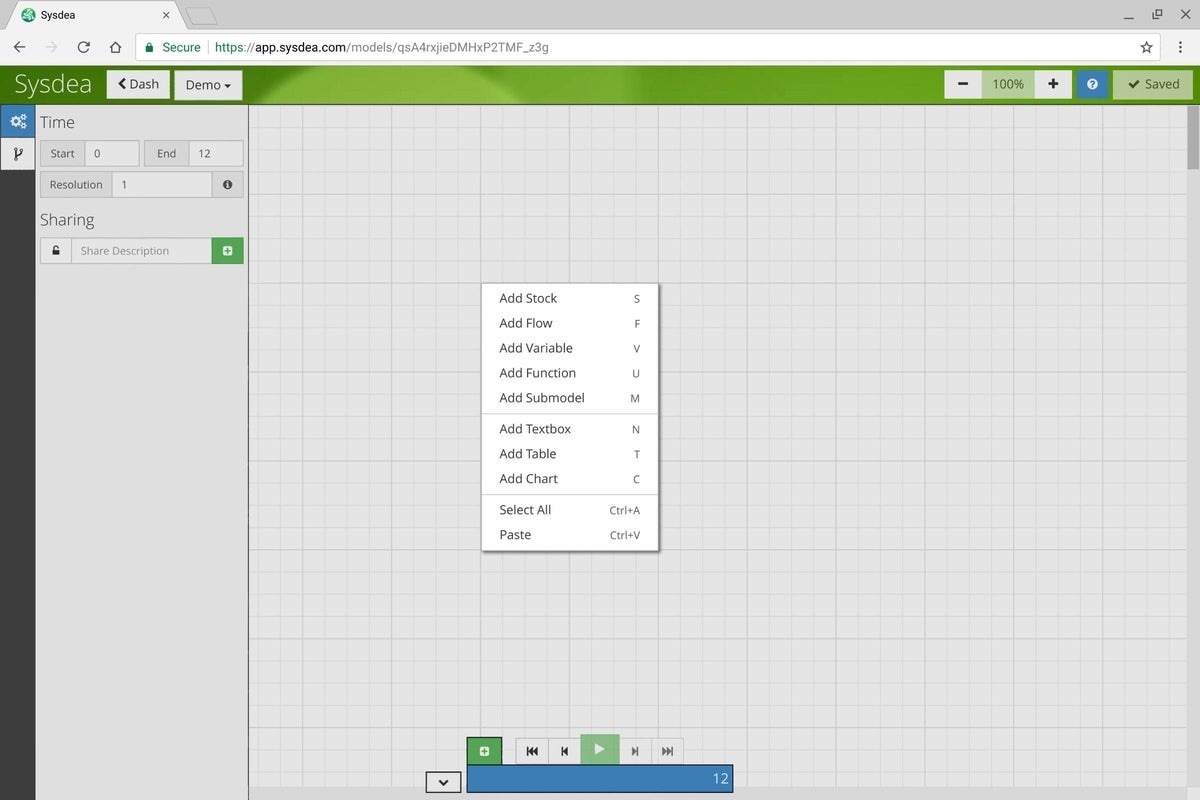
While Sysdea is free for teachers and academic use, the organizational version costs $150 per user per year. Alternatively, a personal version for individual use costs $15 per month.
SEE: Hiring kit: User experience specialist (Tech Pro Research)
Insight Maker
Insight Maker (by Scott Fortmann-Roe) is a free and open source tool that not only handles system dynamics modeling but also supports agent-based models. That means that, as with Sysdea, you can model stocks and flows with the related calculations, but you can also model agents–a population of individuals that behave based on varying probabilities. You might think of this as the difference between modeling an aggregate system result (such as healthcare quality and costs compared between nations) or simulating a population (e.g., the health of a specific population of individuals, such as within a company).
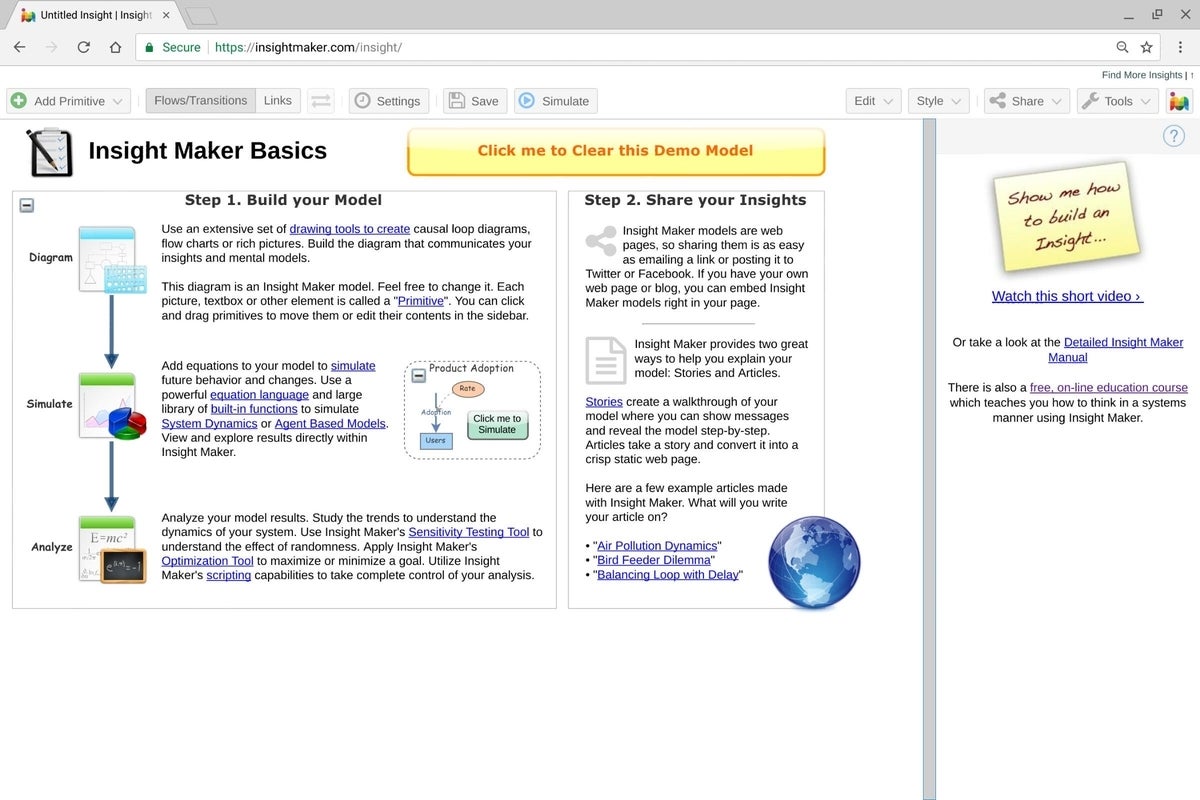
Insight Maker offers several useful documentation and learning resources, as well as the ability to craft a narrative around a model, which the app calls “storytelling.” (Yes, even a system modeling tool offers “stories” these days!) And you can embed your models elsewhere, too. For more ideas about how Insight Maker can be used, take a look at Kishau Rogers’ (@kishau) presentation from OSCON in May 2017.
From hidden and static to visible and dynamic
The next time you struggle to reach a common understanding about a complex system, take a look at your tools. Both a chart (or series of charts) and a spreadsheet (or series of spreadsheets!) can make it difficult for a group of people to see all the entities and relationships in a system. Instead, work with your team to build a model using one of the tools above. The process of identifying entities and connections and quantifying flows may just help the group collectively understand the system in a new way.
Your take
How have you–or your team–used any of the systems modeling tools discussed here? What other web-based tools do you use to support systems thinking? Share your experiences and advice with fellow TechRepublic members.