Most organizations, from the smallest office to the largest enterprises rely on some kind of network monitoring tools to help them analyze performance issues, alert them to threats, and provide reports on the health of the network environment. TechRepublic contributors have kicked the tires on many of them and we’ve received feedback from members on their own favorites. Here is a round up of some of the most used and recommended. Each one is linked back to a more comprehensive overview or tip on each product.
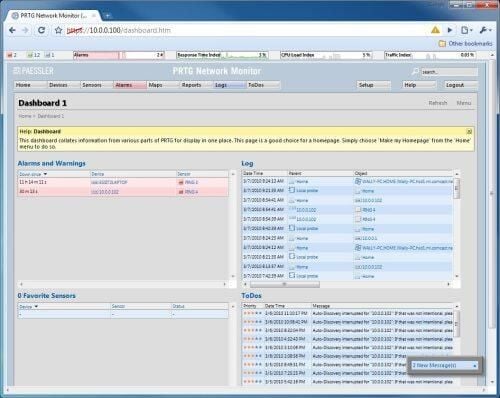
PRTG Network Monitor monitors system availability using a variety of methods from simple ping through SNMP and WMI protocols to specific tasks such as HTTP, DNS, and Remote Desktop availability using various sensors. Using specific sensors for specific machines, an administrator can monitor service availability – including Exchange and SQL – and be notified instantly of problems. Also, PRTG comes with some bandwidth monitoring sensors, so you can ensure that malware designed to do DoS, \u201cphone home\u201d, and other overload activities are not operating on your network.
PRTG supports all Windows versions, XP/2003 or later. See the full spotlight review.
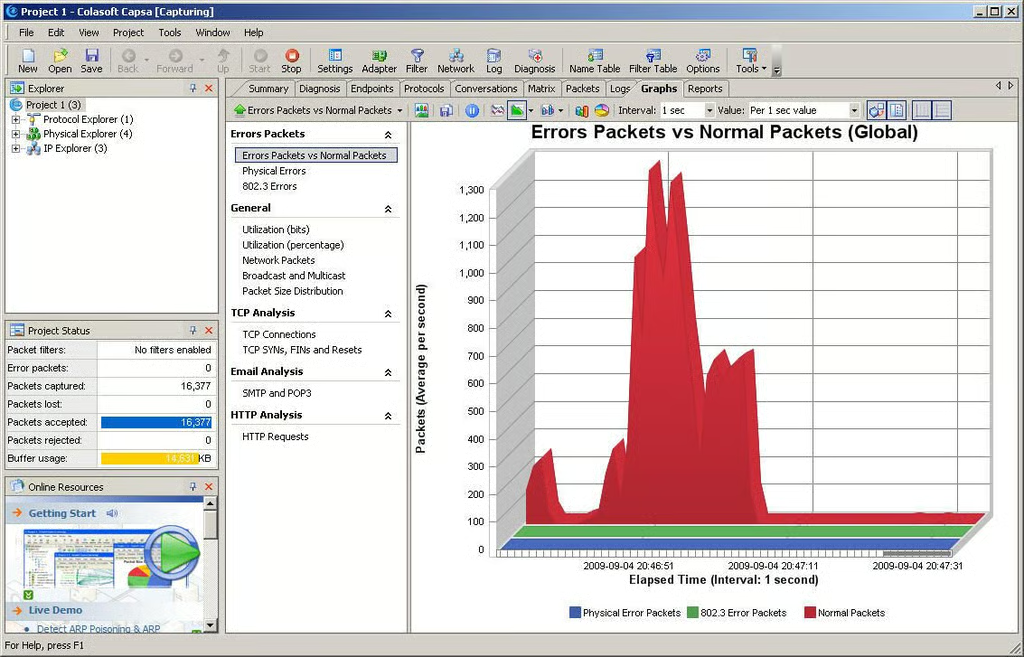
Colasoft software includes a Diagnosis console that lists events separated by OSI layers and enables sorting by severity, source address or event type to help speed recovery. A special Matrix view is available, too, that depicts connections at-a-glance, further enhancing diagnosis.
Supported operating systems are Windows-only: Windows 2000, Windows XP (32- and 64-bit versions), Windows Server 2003 (32- and 64-bit versions), Windows Vista (32- and 64-bit versions), Windows 2008 (32- and 64-bit versions) and Windows 7 (32- and 64-bit versions). See the full spotlight review.
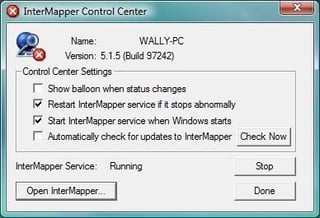
InterMapper monitors system availability using a variety of methods from simple ping through SNMP protocols, to specific tasks such as HTTP, DHCP, DNS, and LDAP availability using customizable probes. Using specific probes for specific machines, an administrator can monitor service availability and be notified instantly of problems.
Supported operating systems include: Windows 2008/Vista/XP/2003/2000, MacOS X 10.4, Solaris, RedHat, Fedora, SuSE, Debian, Ubuntu, FreeBSD. See the full spotlight review.
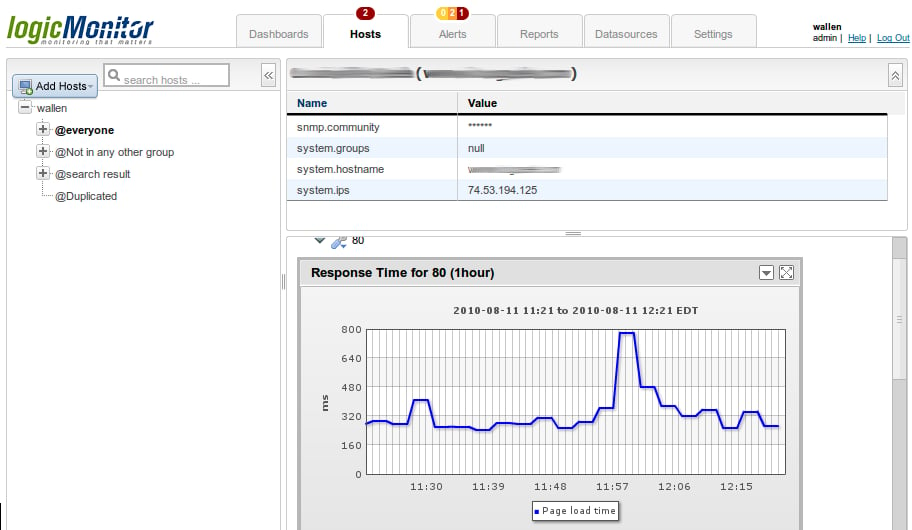
LogicMonitor allows you to add an agent to a machine and have it monitored from your own, personalized dashboard that can be reached from anywhere using a web browser. It will keep you apprised of the status of your network, network equipment, cloud, databases, applications, power infrastructure, and more. See the full spotlight review.
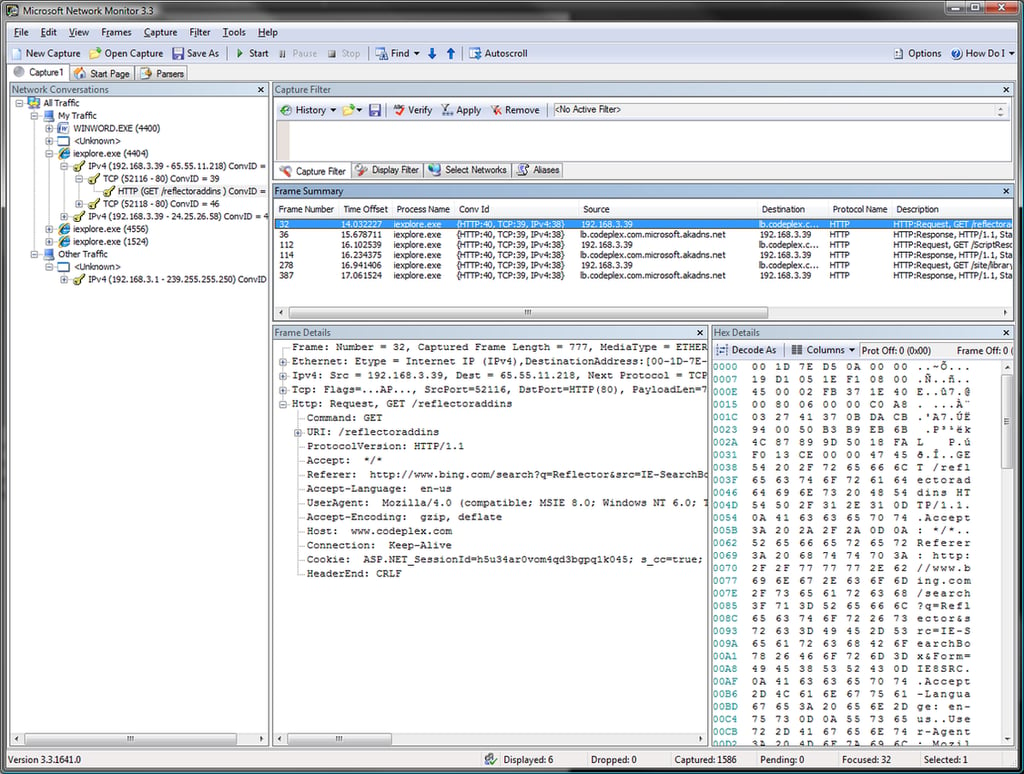
The Microsoft Network Monitor is a free tool for Windows PCs that allows you to see each and every networking packet that arrives at or is sent from the PC. It has robust filtering options and can give you excellent insight into the functionality of your applications.
It has powerful filtering capabilities and an “experts” feature allows developers to write advanced processing functionality to extend the application beyond the packet filters. See the full spotlight review.
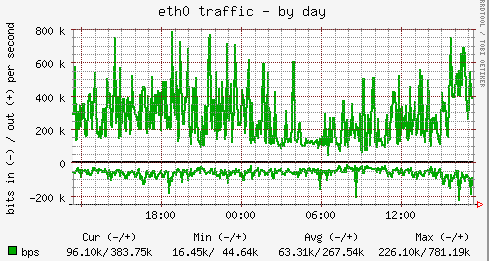
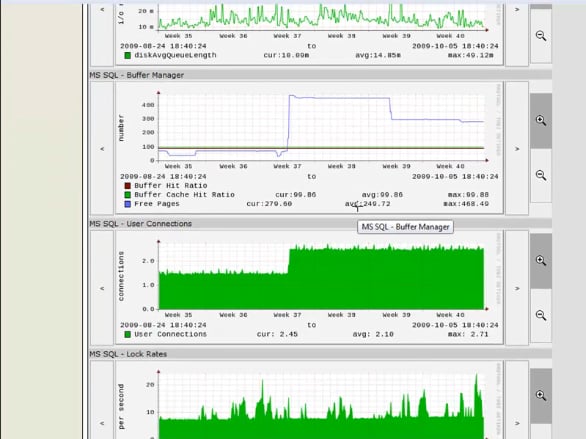
Munin is an open source application that enables the administrator to monitor and collect data for networks, PCs, SANS, and even applications. With a very robust plugin framework (and plenty of available plugins), Munin is one of the most flexible network resource monitoring systems available.
Munin is available for UNIX and UNIX-like operating systems including: Linux, FreeBSD, NetBSD, Solaris, AIX, OS X / Darwin supported in trunk, and HP-UX. See the full spotlight review.
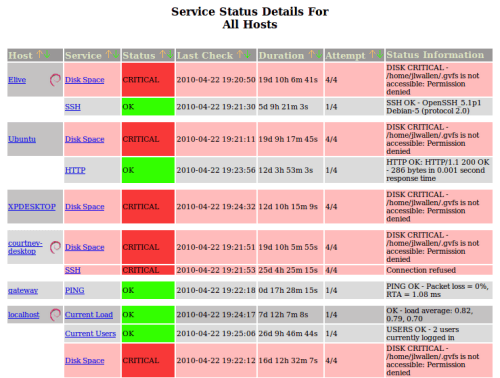
Nagios is a cost effective, flexible tool that also happens to be open source. Nagios is relevant for any sized network. From SMB to Enterprise, it can handle just about anything you have. But while it’s simple to install, making it work for you can take some time and tweaking. There are configuration files to edit, plugins to add, and more. It’s stand-out features are scalability, an easy-to-navigate web interface, lots of plugins, alert system, event handlers, and reports. See the full spotlight review.
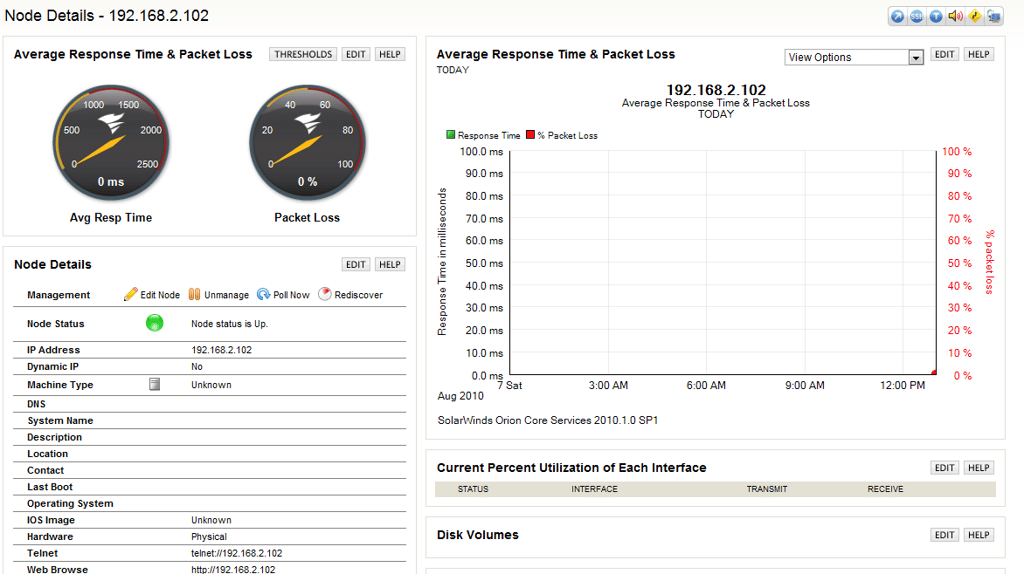
Orion Network Performance Monitor is the ticket for large, complex network environments. Stand-out features are the web interface, an integrated Wireless Poller to monitor wireless devices, and easily customizable reports. See the full spotlight review.
Snort is a Network Intrusion Detection System (NIDS), which can view and analyze packets on a network to determine whether or not a system is being attacked by remote. Most Linux distributions come with Snort; it can write its collected information to a variety of different sources for later analysis, be it flat files or a database such as PostgreSQL or MySQL. As well, Snort can be used as a simple packet logger, sniffer, or a full-blown NIDS.
See Vincent Danen’s Linux tip for further details.
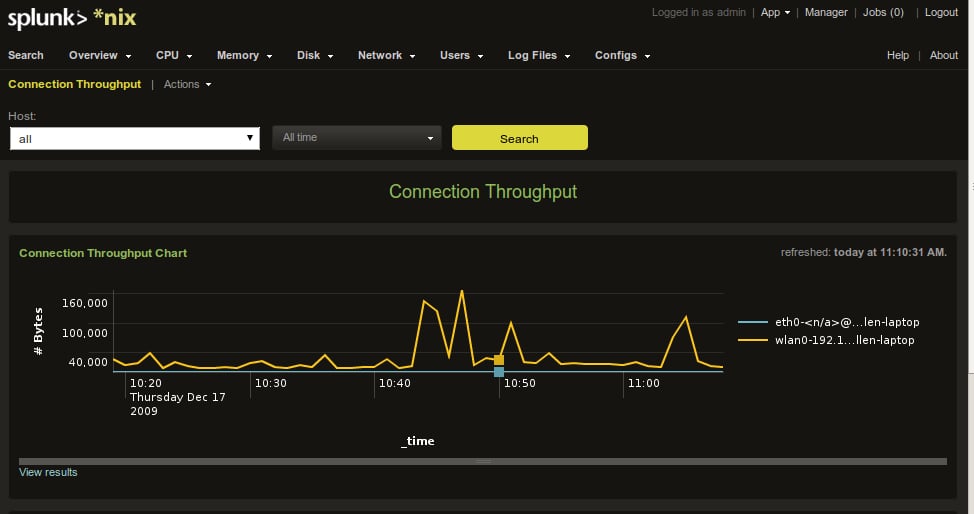
Splunk allows you to index, search, alert, and report on both live and archived IT data. Splunk is a modular Web-based tool that allows you to add or subtract apps to match your needs. There are both free and enterprise versions available for Windows, Linux, Mac, AIX, Solaris, and BSD.
Splunk collects data from multiple sources on your network and analyzes that data in one, centralized, Web-based location. See the full spotlight review.
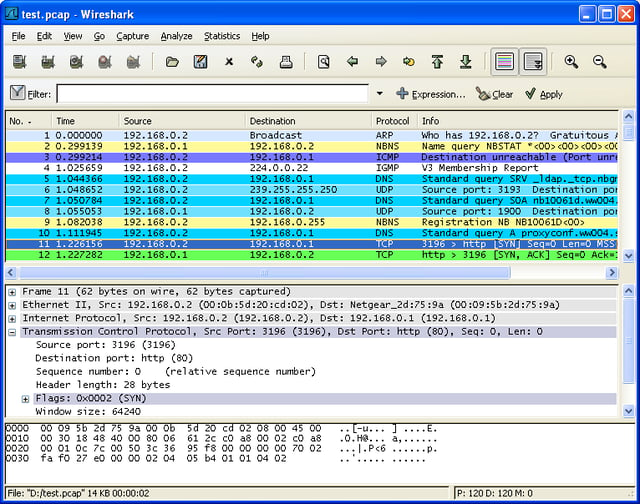
Wireshark solves the problem of being able to analyze network traffic on any size network. Wireshark does this with the power often found in more costly tools, but for free. So any IT department in need of a powerful network analyzer, but without the budget to purchase such power, can turn to Wireshark and miss nary a feature.?Some standout features are: data can be viewed live or from previously captured files, live data can be captured from numerous network interfaces and types, decryption is supported, and reports can be exported to XML, PostScript, CSV, or plain text. See the full spotlight review.?
Zenoss is quite similar to Nagios, but reduces a lot of the configuration complexity. The unfortunate thing is that the Web interface can be quite intimidating, despite it dispensing with a lot of complexity in how monitored hosts are configured. Zenoss is available for a number of operating systems. You can install packages built for most flavours of Linux and Mac OS X, or build it from source on any other system where there are no packages pre-built. Also available are virtual appliances for VMware.
See Vincent Danen’s Linux tip for further details.

Selena Frye is a former Senior Editor for TechRepublic. Her background is in technical writing, editing, and research. I edit the Data Center, Linux and Open Source, Apple in the Enterprise, and IT Security blogs.


