Axence NetTools Professional 3.0: The Right Tool for the Job?
Image 1 of 25
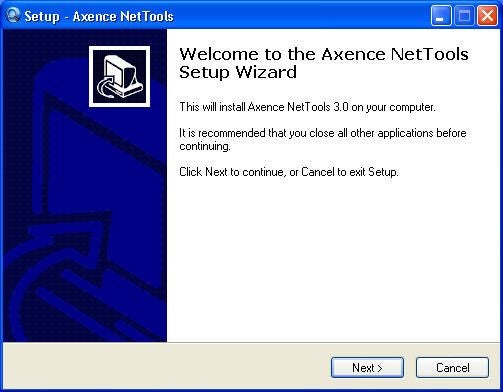
Axence NetTools setup
Every administrator requires ready access to Windows system, service and hardware information. Axence NetTools packs all that data into a single app, while adding an entire suite of powerful networking utilities. But how well do all those tools work together? Erik Eckel test drives Axence NetTools Professional in this Right Tool gallery.
You may download a free, trial version of Axence NetTools here.
Axence NetTools 3.0 setup is straightforward. Download the executable install file and double-click it to begin installation.
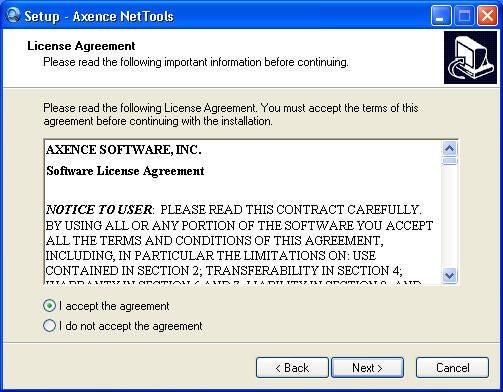
Axence NetTools setup
As with most every software application, you must accept Axence’s license agreement to use its software.
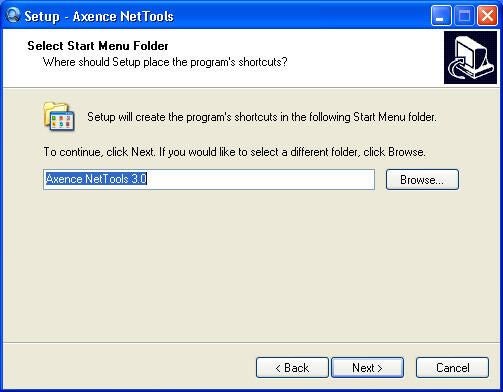
NetTools Installation
In addition to specifying the application’s destination location, users must name the folder Axence creates within the Start Menu folder.
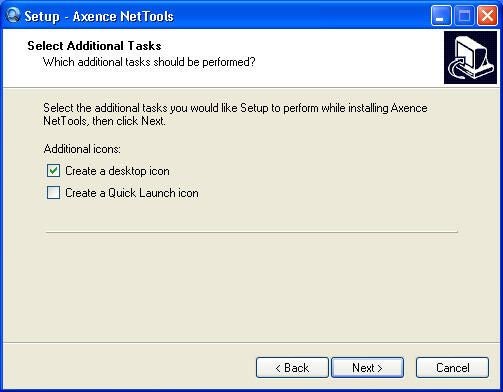
Additional NetTools tasks
When installing NetTools 3.0, users can elect to create desktop and Quick Launch icons.
NetTools installation
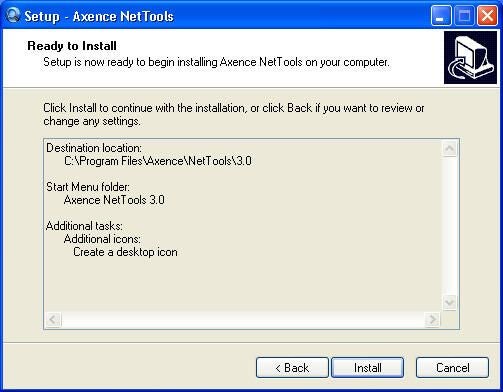
Before installing itself, Axence provides this summary screen. To begin installing NetTools 3.0 with all the options selected during Setup, users need only click Install.
Axence NetTools installation
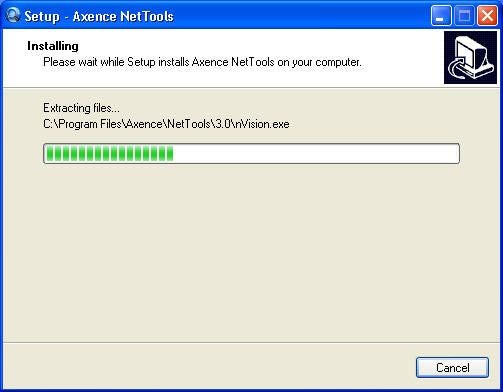
Once the Install button is clicked, Axence extracts and installs the NetTools files.
NetTools setup complete
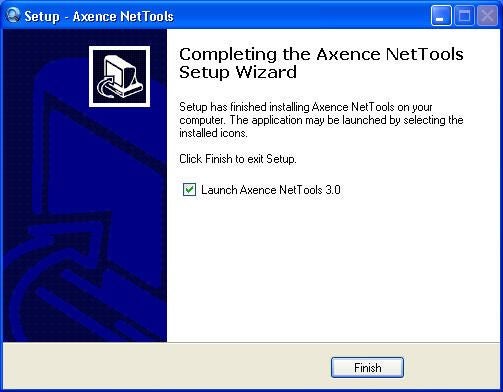
When Axence NetTools setup completes, the application displays this confirmation page.
NetTools NetWatch
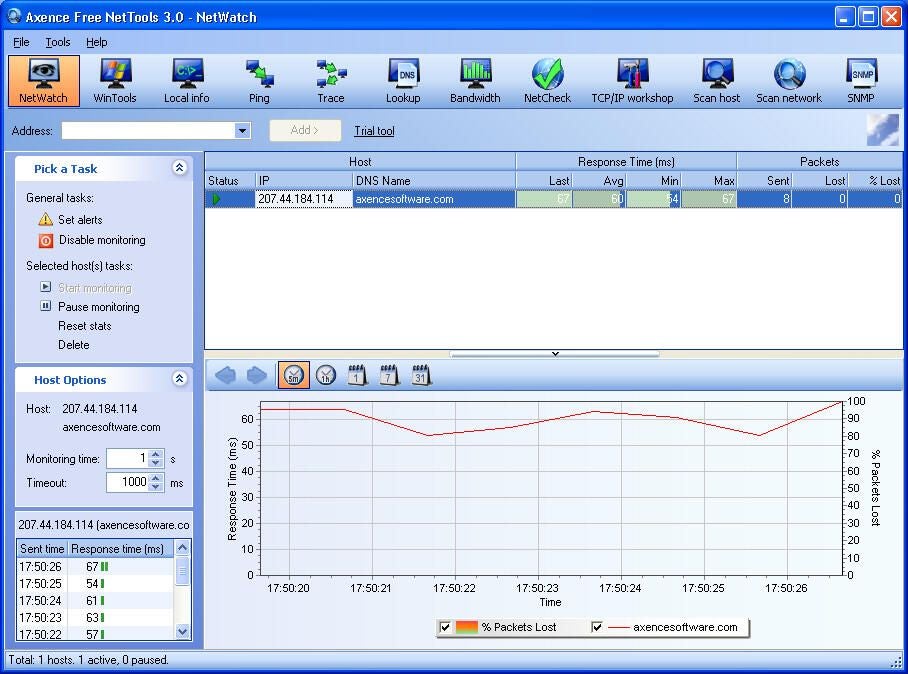
The NetTools 3.0 console is easy to navigate. All principle tools, from the NetWatch utility shown here, to DNS lookup and trace tools are easily accessed from the prominent toolbar.
By placing independent icons for each utility within that tool bar, Axence has done busy systems administrators a favor: switching between utilities is quick and easy thanks to the console’s design that places each applet just a click away. Administrators no longer need to switch between applications (or navigate numerous sub menus) to jump from viewing services information to reviewing DNS data. With NetTools, a wide variety of commonly used administrative tools are packed into a single console.
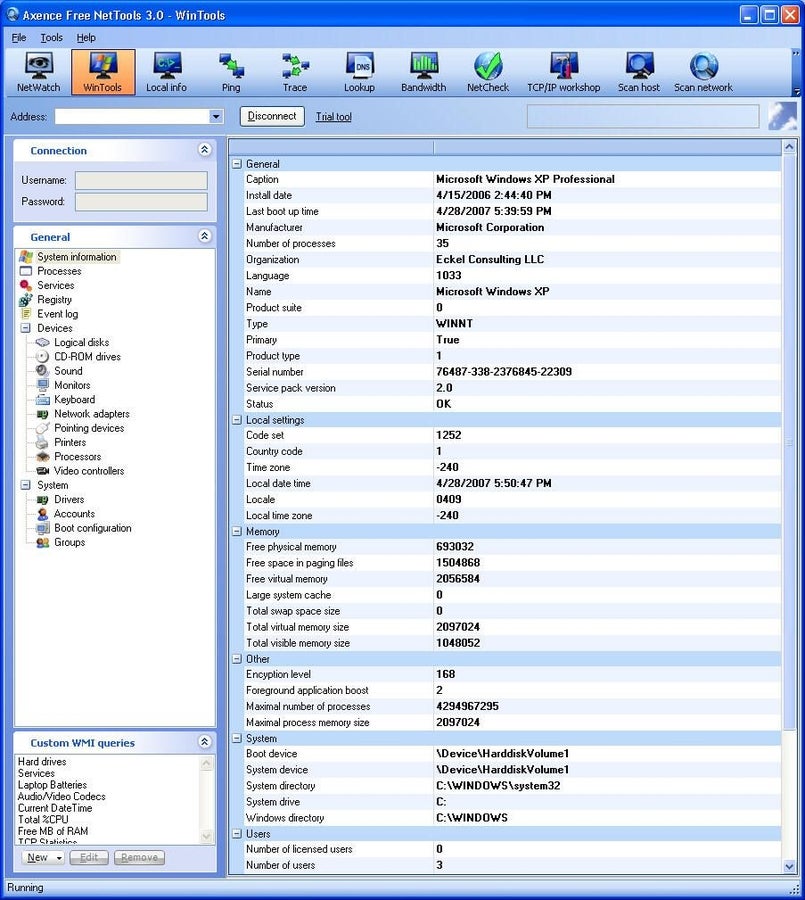
NetTools WinTools
The WinTools utility provides feedback on a laundry list of Windows system information. From viewing running processes and active services to reviewing hardware component data, WinTools provides quick access to frequently sought system information.
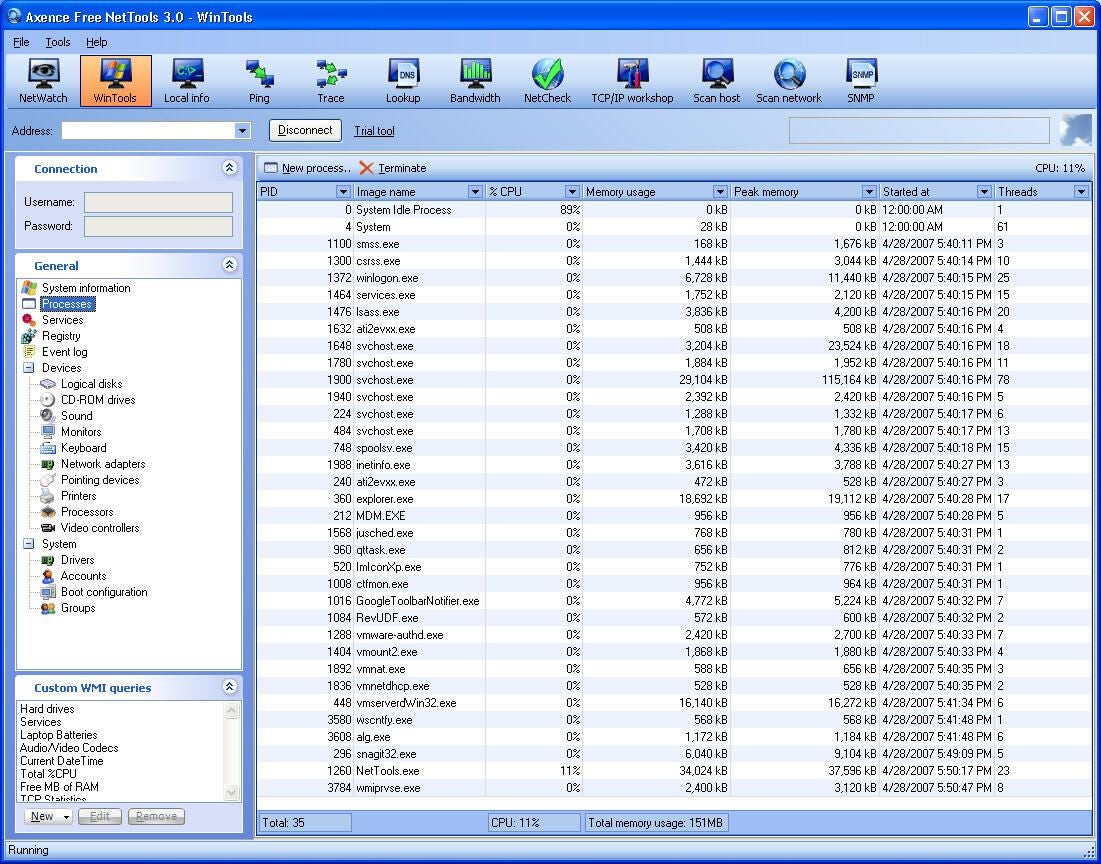
Active processes
NetTools’ WinTools feature allows administrators to quickly view a list of running system processes. In addition to naming the process, WinTools lists the processor ID (first column), percentage of CPU that process is commanding (third column), peak memory (fourth column) and more.
Such data proves critical when tracking down rogue programs, spyware and other issues.
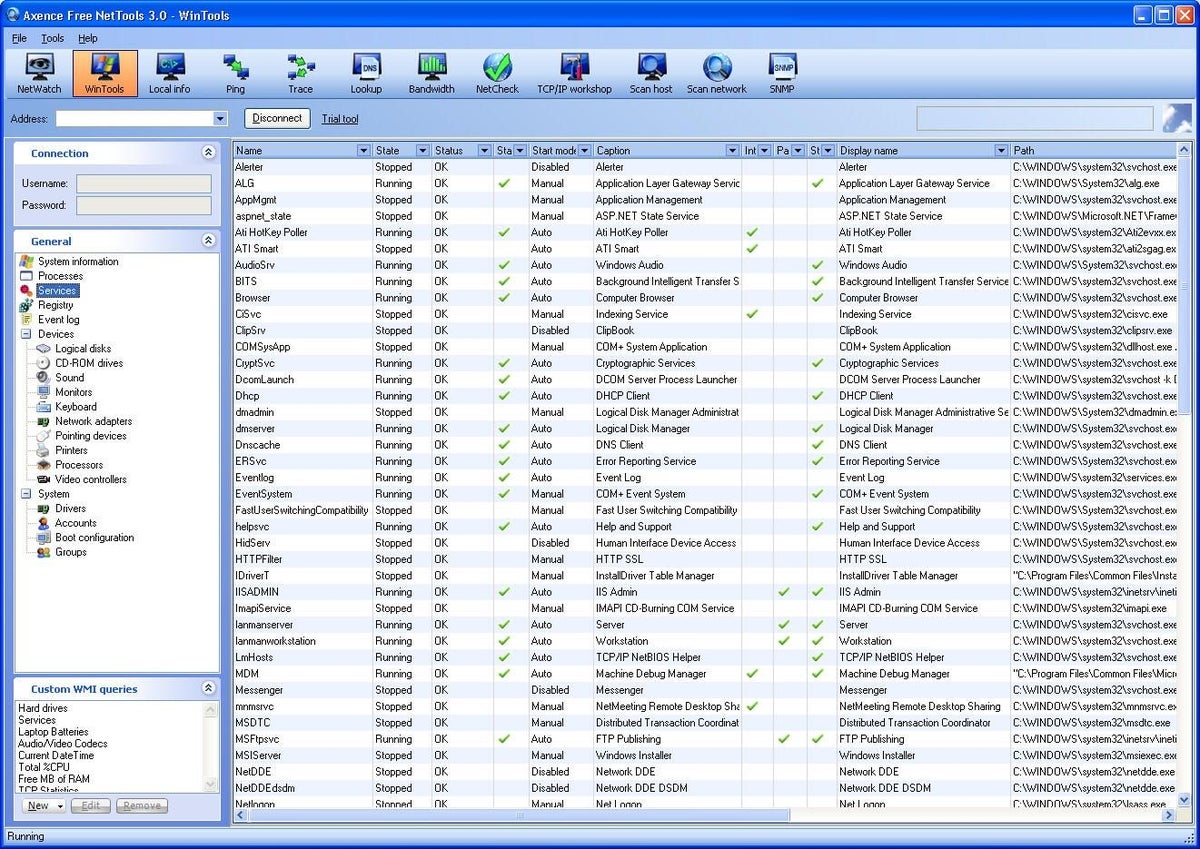
WinTools services
Just as with system processes, WinTools also displays comprehensive information on active services. In addition to being able to view at a glance whether a service is active, admins can see whether services are set to start automatically or must be manually triggered.
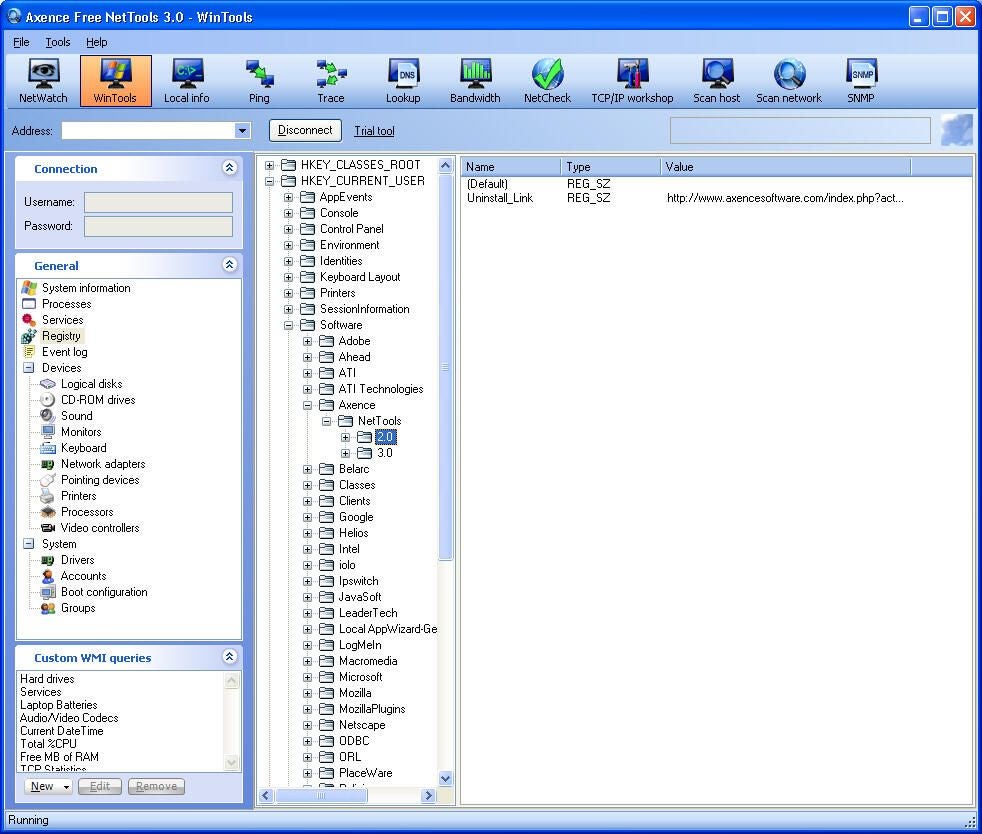
Registry review
NetTools 3.0 also includes a basic Registry editor, shown here.
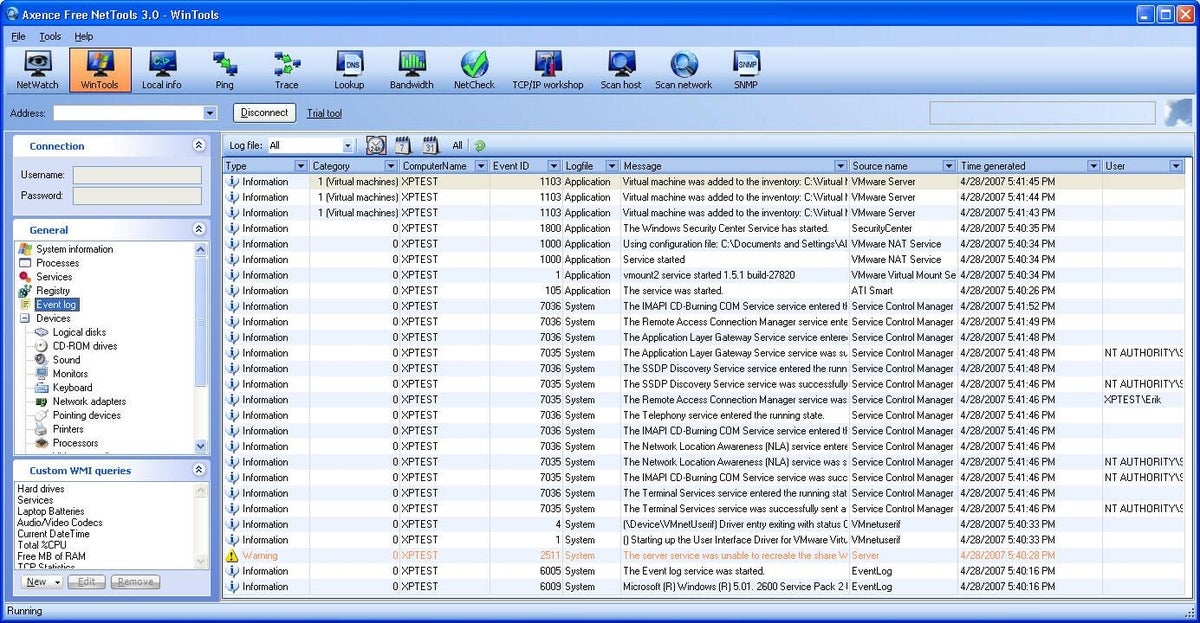
WinTools event log
The NetTools WinTools console provides a creative twist on viewing Windows’ event logs. Instead of listing events separately by category (system, event and security, as is typical using Windows Event Viewer), WinTools lists a variety of events within a single window. Rather than having to double-click each event (within different category trees no less) as with the standard log viewer, WinTools makes it possible to review data on multiple events simultaneously without requiring additional clicks.
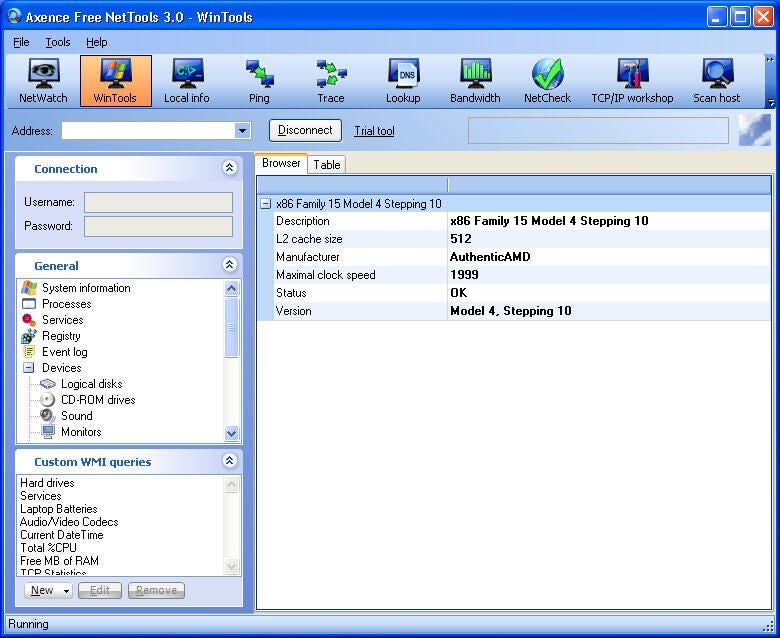
NetTools system information
WinTools also reports on system hardware. Here you can see the application listing CPU data.
While it’s a little odd to include such system audit tools within a networking utility, having handy access to NIC information seems a natural fit when troubleshooting networking failures.
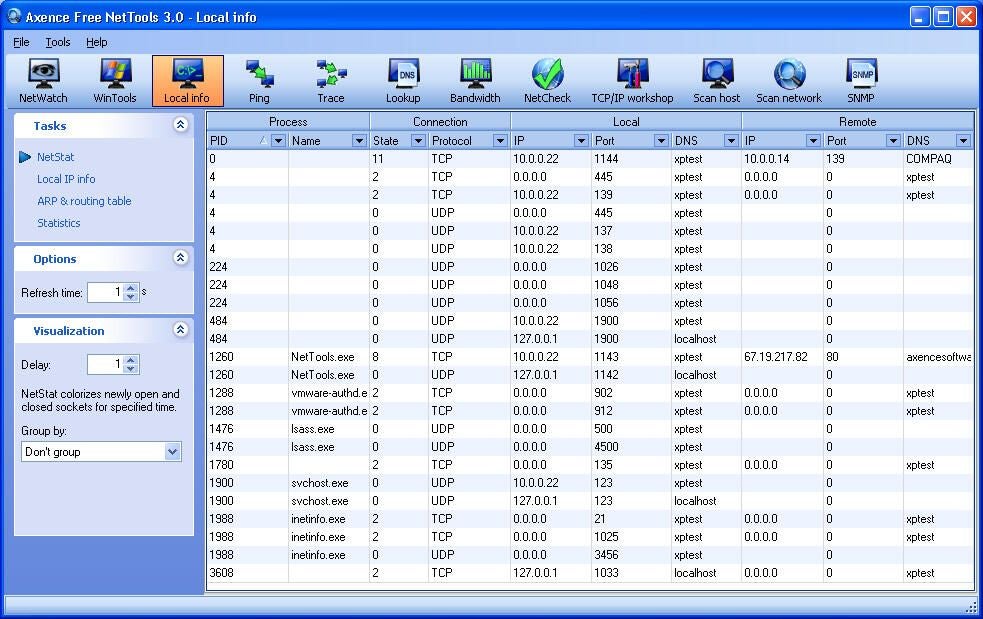
NetTools local info
The local info screen displays NetStat data, local IP addressing information, ARP and routing tables and networking statistics for the workstation or server on which it’s installed.
While all the data displayed here is essentially readily accessible from the command line, being able to display the results of numerous different command line switches simultaneous will prove a welcome time saver for most every network administrator.
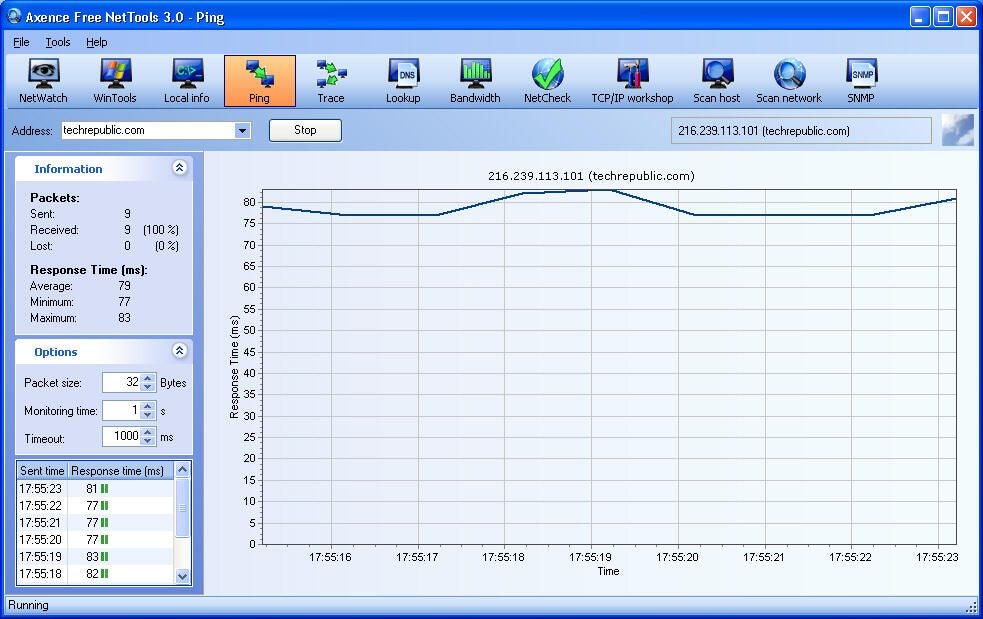
NetTools ping tool
The ping tool provides a graphic representation of the common TCP/IP ping command. In addition to the graphic view prominent within this screenshot, the utility displays sent/received information and tracks response times in the left-side boxes, too.
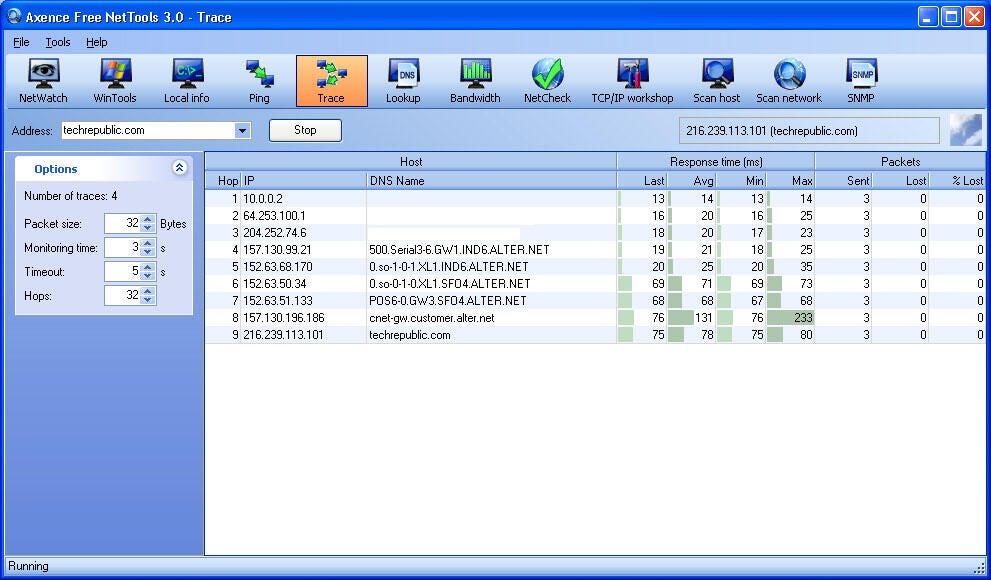
NetTools trace utility
The Trace console enables an administrator to enter a Web or IP address within the address bar and view the results graphically.
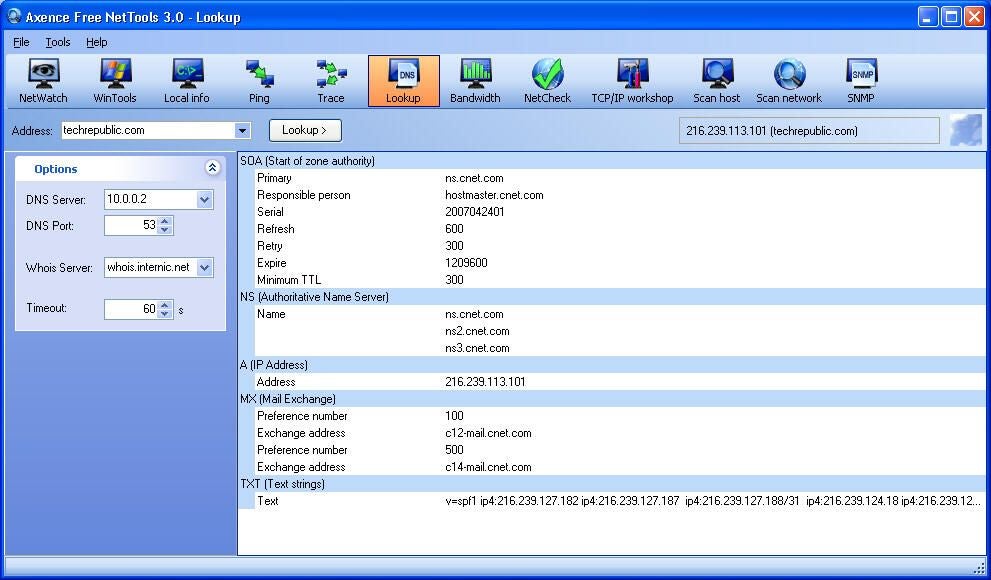
NetTools lookup
Administrators can also perform DNS lookups on addresses using the Lookup tool. In addition to displaying the DNS server being used (in this case 10.0.0.2), the Lookup window displays SOA, NS, A, MX and TXT results.
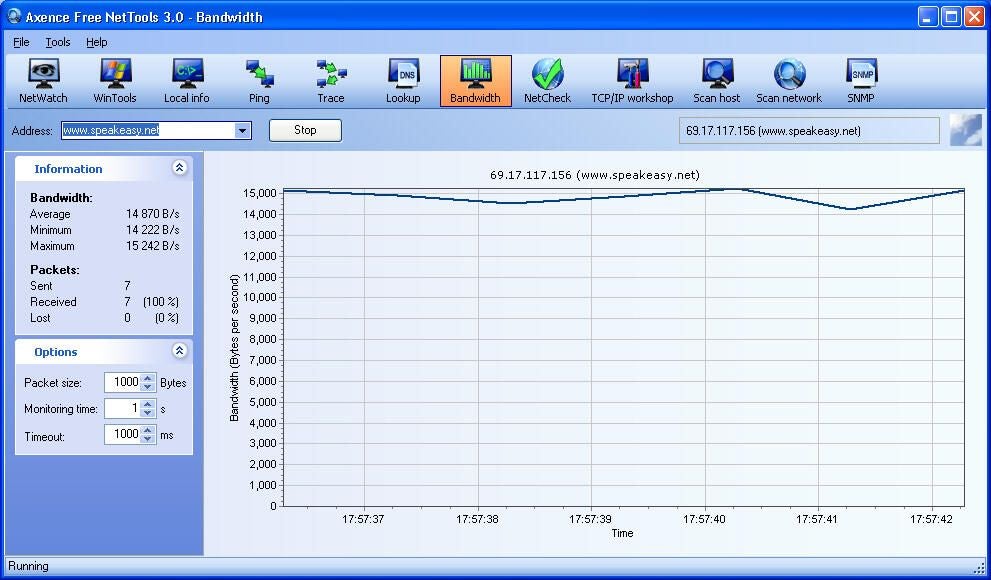
NetTools bandwidth utility
NetTools includes a bandwidth tool that can be used to test a connection’s throughput. Besides displaying a graphical representation of the results, the utility lists statistical information in the left-hand boxes.
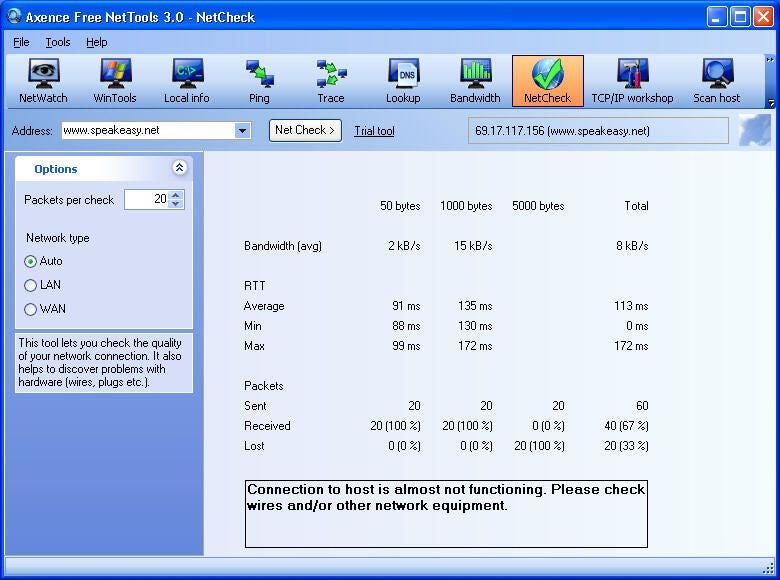
NetTools NetCheck
Administrators can perform tests to gauge the quality of their network connections. When the utility encounters trouble, NetCheck displays error data within the supplied box, as shown here.
In the case of this test, the error reporting proved helpful. The 50 byte and 1000 bytes tests completed without incident, but the 5000 bytes test suffered packet loss. There were no issues with network cabling. However, the tests were conducted on a network with a switch known to be going bad.
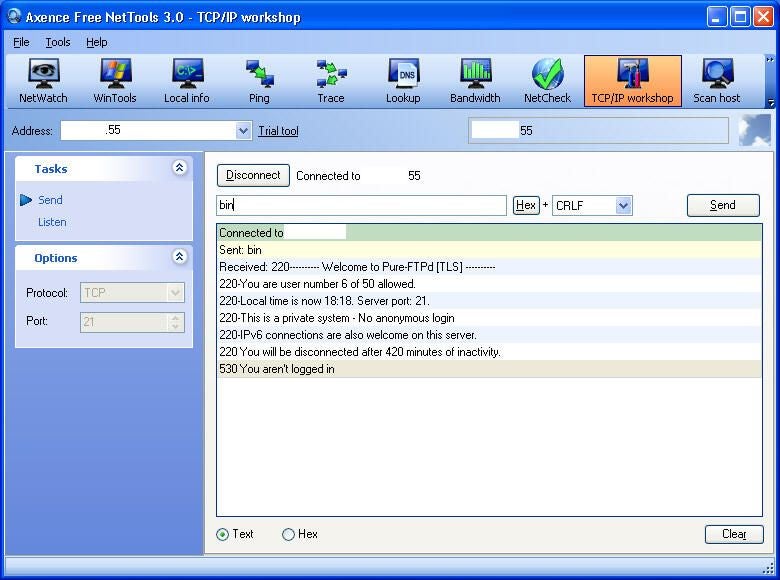
NetTools TCP/IP workshop
Administrators troubleshooting particularly problematic networking issues can turn to NetTools TCP/IP workshop. Here you can see the tool provides a graphic representation of common command line commands.
When under the gun, being able to quickly switch from a Ping or Trace tool to in-depth TCP/IP troubleshooting proves handy. Rather than have to open new console windows and type new commands (with corresponding switches), admins need only navigate NetTools icons.
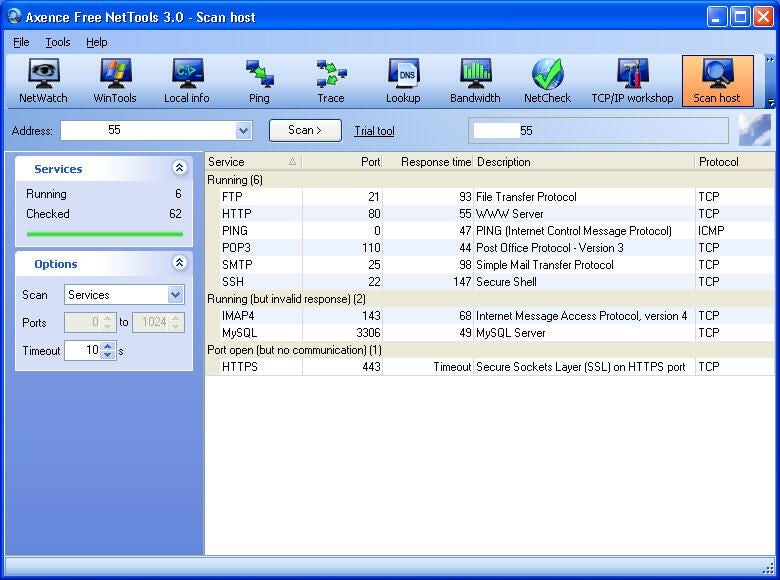
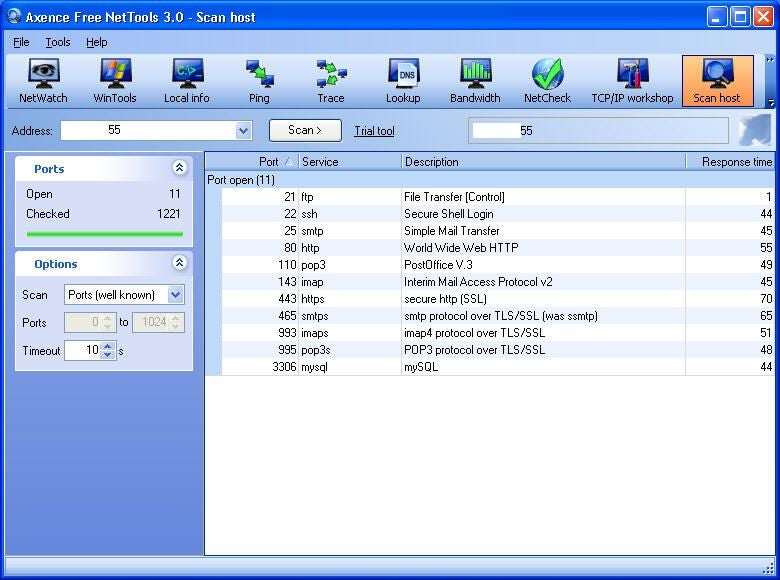
NetTools scan host
NetTools 3.0 Professional includes a scan host tool that enables connecting to specific systems (either by Web or IP address) and performing port scans. Results are displayed, along with corresponding descriptive information, in a more intuitive format than is available from the command line.
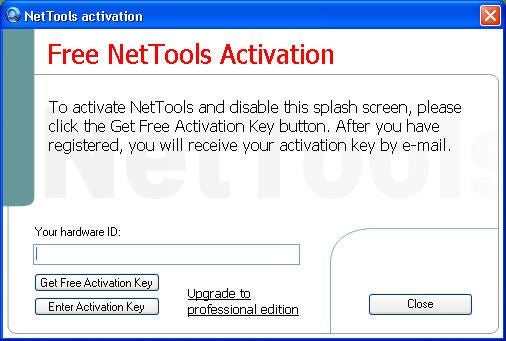
NetTools activation
Axence allows users to test the NetTools suite free for a short time. After the trial expires, administrators can license the program for $99 per workstation (which includes three months of upgrades and technical support).
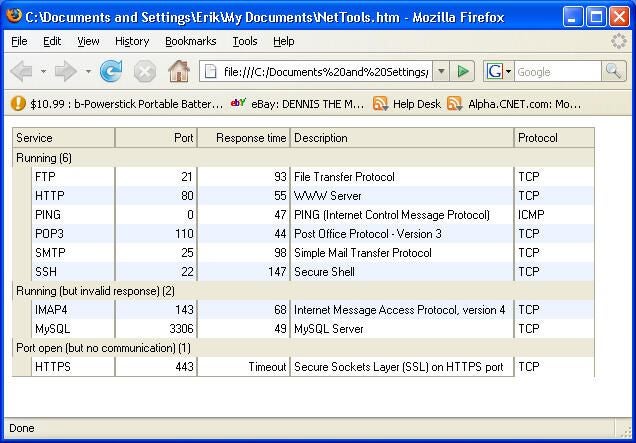
Data export
Another feature within Axence NetTools 3.0 Professional that will prove helpful to many administrators is an export function. Users can export data from any of the suite’s tools to an HTML format (which can be used to create history or troubleshooting logs).
Additional scan host features
In addition to scanning active services, the scan host tool can check open ports to help spot vulnerabilities.
So, is Axence NetTools 3.0 Professional the right tool for the job? With such a wide range of features, from the port scanning capacity to service and process review, NetTools serves as a potent tool that will work well for many administrators. While the (per workstation) pricing may place the utility out of reach for small business consultants, admins responsible for monitoring or troubleshooting particularly cantankerous systems full time will find the utility’s time-saving nature helps pay for itself quickly.

-
Account Information
Contact Erik Eckel
- |
- See all of Erik's content
