From the Splunk main window you can see what apps you have installed, work with those apps, and install new apps.
For a full review of Splunk, check out the TechRepublic Product Spotlight Blog.
Image created by Jack Wallen for TechRepublic.
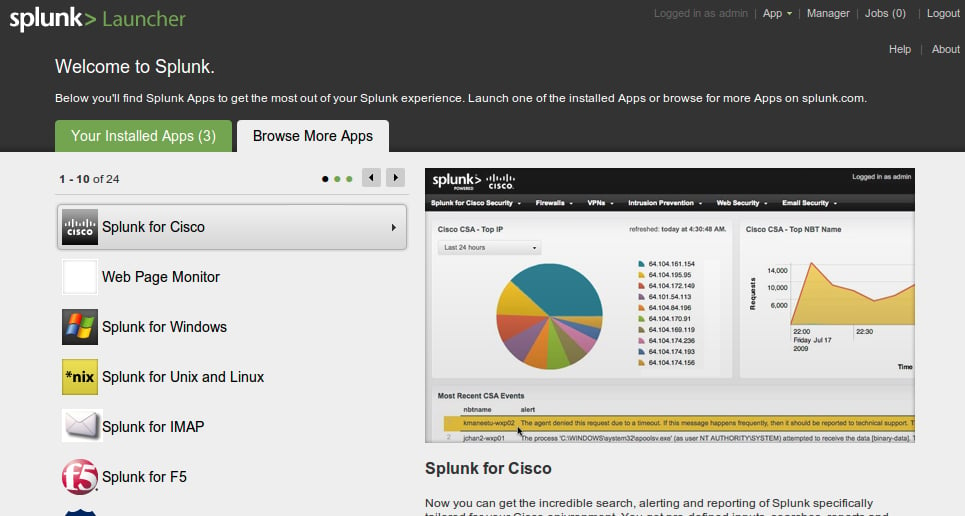
You can browse for available applications from this tab in the main window.
For a full review of Splunk, check out the TechRepublic Product Spotlight Blog.
Image created by Jack Wallen for TechRepublic.
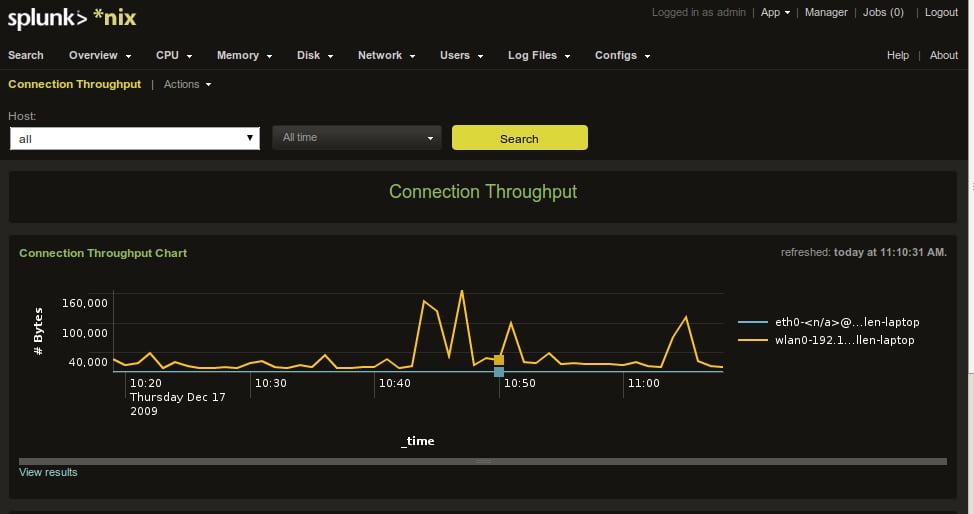
A newly installed Splunk, watching a single machine on a wireless LAN gives you throughput data that is easy to read.
For a full review of Splunk, check out the TechRepublic Product Spotlight Blog.
Image created by Jack Wallen for TechRepublic.
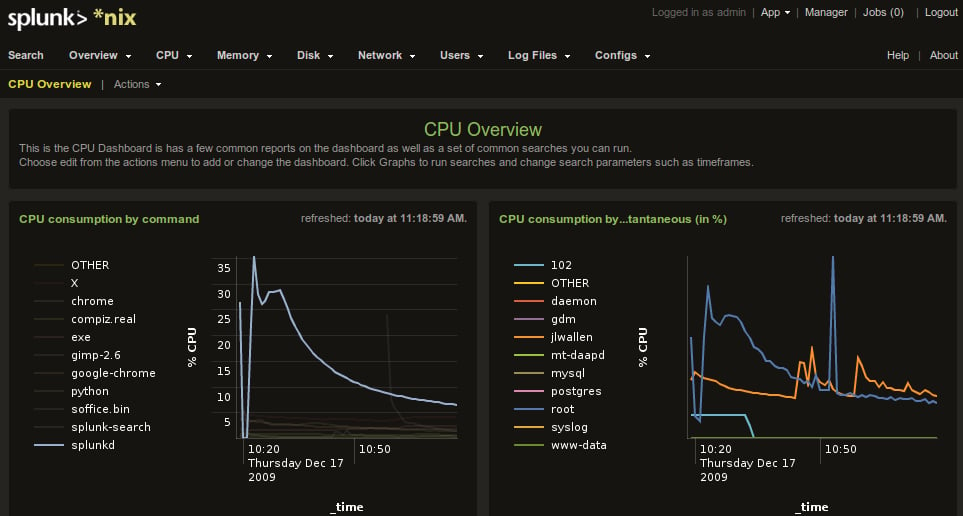
These graphs give you an instant peak into what is consuming your CPU cycles.
For a full review of Splunk, check out the TechRepublic Product Spotlight Blog.
Image created by Jack Wallen for TechRepublic.
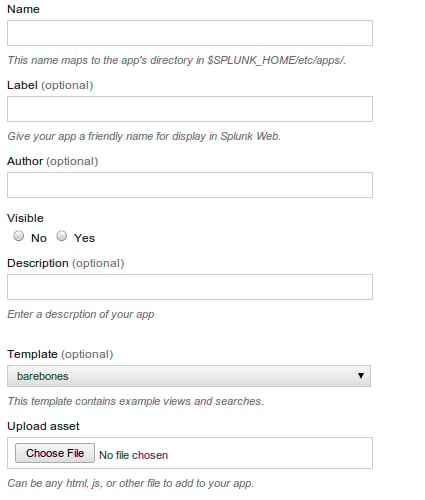
If you can’t find an application to suit your needs, create of your own.
For a full review of Splunk, check out the TechRepublic Product Spotlight Blog.
Image created by Jack Wallen for TechRepublic.
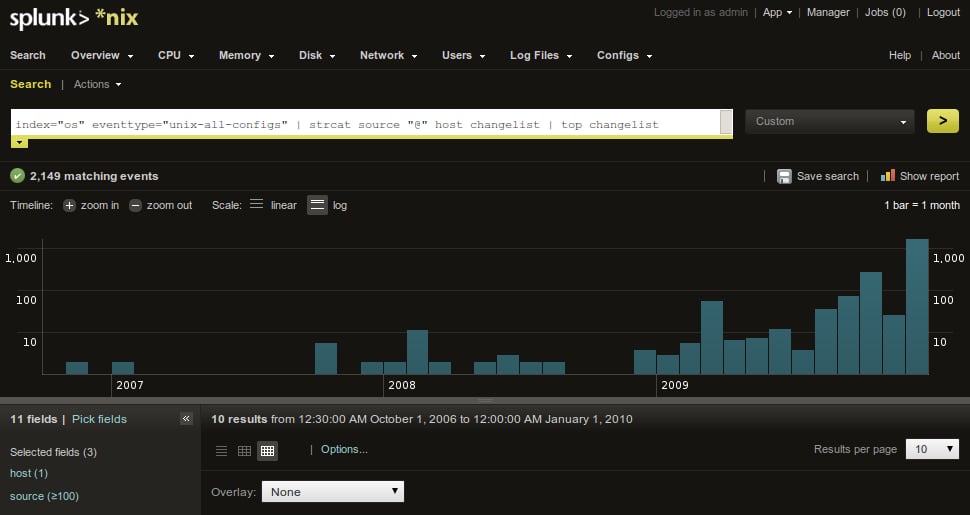
The NIX module can monitor any type of *NIX (UNIX, Linux, etc) data available.
For a full review of Splunk, check out the TechRepublic Product Spotlight Blog.
Image created by Jack Wallen for TechRepublic.
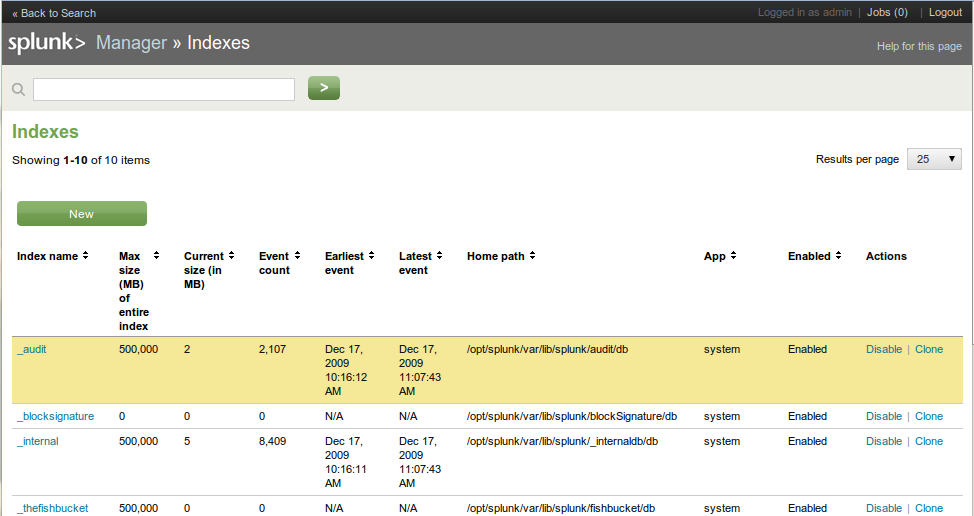
Manage indexes.
For a full review of Splunk, check out the TechRepublic Product Spotlight Blog.
Image created by Jack Wallen for TechRepublic.

Jack Wallen is an award-winning writer for TechRepublic, The New Stack, and Linux New Media. He's covered a variety of topics for over twenty years and is an avid promoter of open source. For more news about Jack Wallen, visit his website jackwallen.com.


