
\n\tInfrastructure performance is a core part of the services that run the business, and performance problems can plague IT departments and be difficult to nail down. Fortunately, a number of free tools are available that will monitor your network’s performance and help identify looming bottlenecks before they become an issue.
\n
\n\tNote: You can read the full post in our Five Apps blog.
\n
\n\tPhoto: Copyright \u00a9 iStockphoto.com/johan63
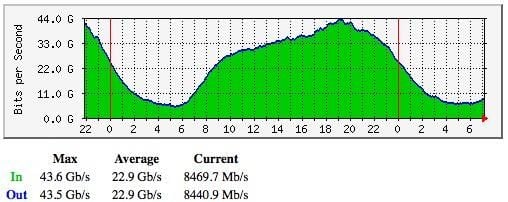
\n\tMRTG is the granddaddy of free network monitoring tools and provides basic but extremely useful information. Like all the tools featured here, MRTG gathers information using SNMP and then displays the trends that are inherent in the data. Here’s a daily view of a router being monitored by MRTG.
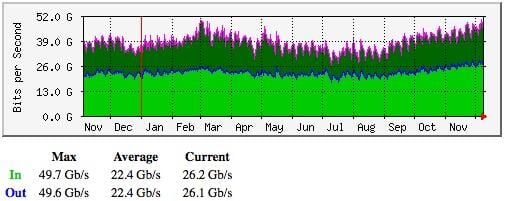
\n\tThis graph is displaying the information that has been gathered for the past year. This is the real power in these tools — they provide you with the data you need to make good decisions about your services and infrastructure.
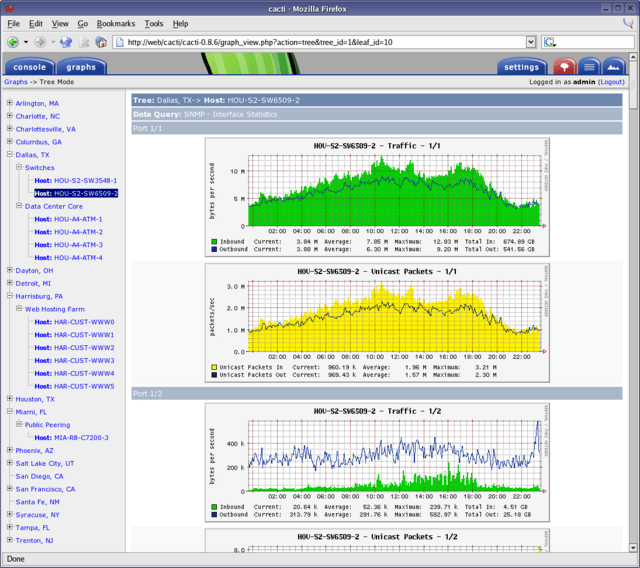
\n\tCacti is intended to be a front-end system for RRDTool. (RRDTool is a general purpose “high performance data logging and graphing system for time series data.”) Cacti uses a MySQL database to store all the information that RRDTool needs to create graphs. It allows you to create data sources (generally SNMP connections to monitored devices), gathers data from those devices, allows you to group graphs from like systems, enables you to manage user permissions to the monitored data, and much more.
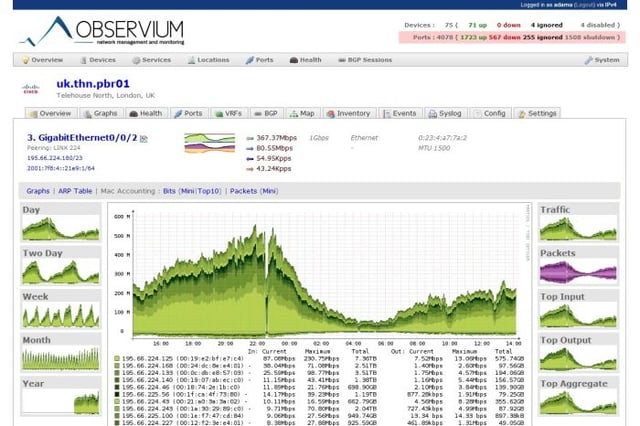
\n\tObservium is an autodiscovery tool that supports numerous network and operating systems. It provides a lot of information in a way that makes it easy to consume.
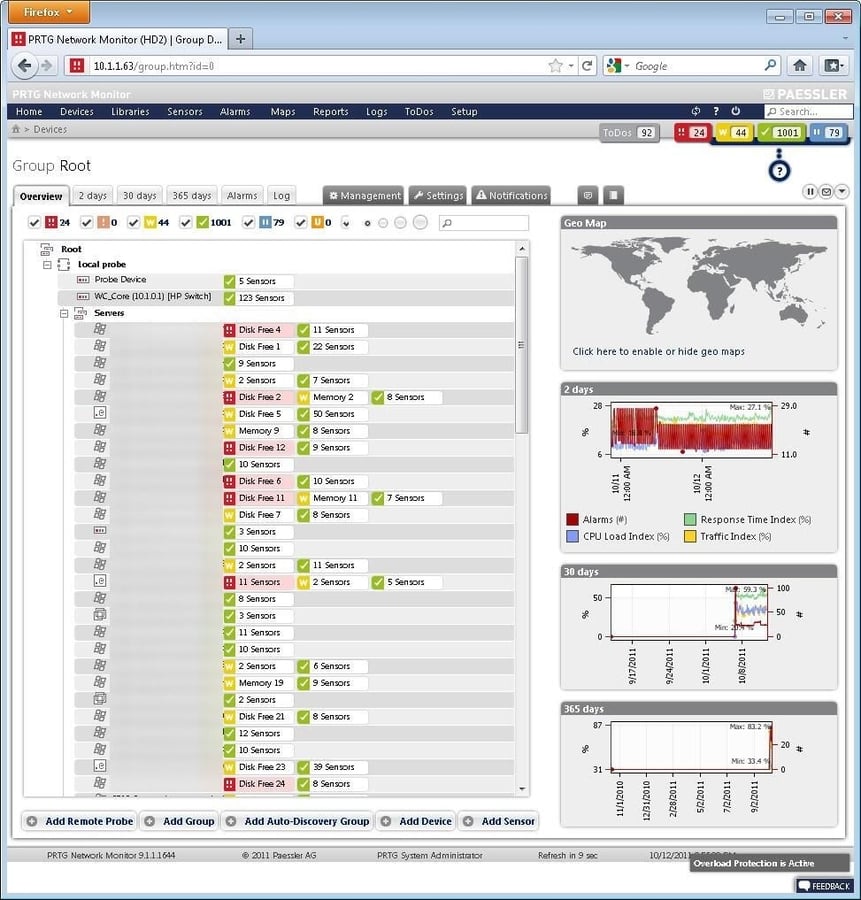
\n\tPRTG (Paessler Router Traffic Grapher) offers a quick way to begin monitoring a lot of network devices without requiring a lot of setup. PRTG also allows you to monitor other key systems, such as Exchange, SQL, VMware, and Windows, through the use of Windows Management Instrumentation (WMI) and connections to vCenter and ESX/ESXi hosts.
\n
\n\tYou can deploy a free edition of PRTG, but you get only 10 sensors (monitoring elements). You would use one sensor to monitor disk space, another one to monitor RAM usage, another one to monitor total bandwidth usage, and so forth. You can quickly rack up hundreds or thousands of sensors. While this might sound like a sneaky way to charge you more money, the fact is that you get a great deal of choice over exactly what you’d like to monitor.

With close to twenty years of experience in Information Technology, Scott has experience across the board in the industry. Recently, Scott left his position as Vice President and CIO for a small private college to launch a consultancy -- The 1610 Group -- aimed at the SMB space and K-12 and higher education.


