Microsoft is gradually rolling out a new feature for Office 365 subscribers called Insights in Excel. This new tool has been in preview for participants in the Office Insiders program for a few months but has now been released to everyone. The tool promises to apply the power of cloud-based artificial intelligence and machine learning to your Excel data sets to reveal new patterns and hidden information that you may have overlooked.
Must-read Windows coverage
- CrowdStrike Outage Disrupts Microsoft Systems Worldwide
- 10 Best Project Management Software for Windows in 2024
- Windows 10 Extended Security Updates Promised for Small Businesses and Home Users
- Securing Windows Policy
Once Insights is installed, accessing it is as simple as clicking a specific button on the Office Ribbon. However, getting the tool to actually provide useful information is a bit more problematic. Insights demonstrates both the promise of artificial intelligence and the elusiveness of its effective practical application.
This brief tutorial article shows you how to implement Insights and explains some of the difficulties you may encounter when trying to apply artificial intelligence to real-world data sets.
SEE: Artificial intelligence: Trends, obstacles, and potential wins (Tech Pro Research)
Excel Insights
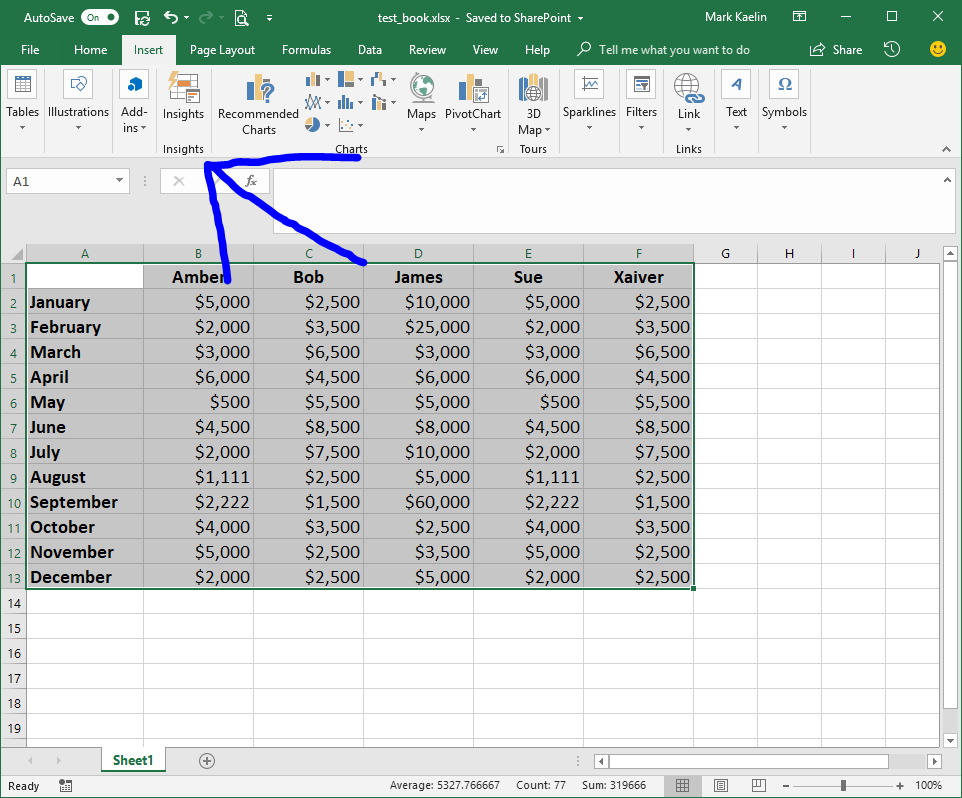
To apply Insights, highlight your data set in Excel (give it a label if you prefer) and then navigate to the Insert tab on your Office Ribbon. Click the Insights button, which is defaulted to lie in the middle of the Ribbon (Figure A).
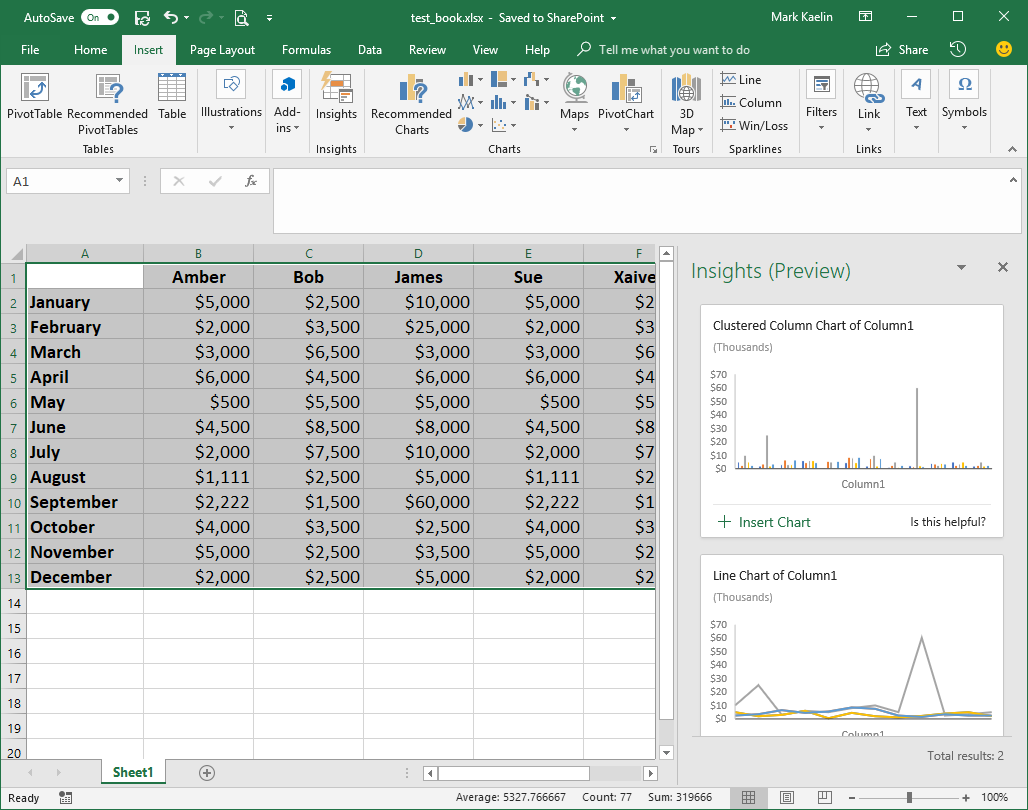
When you click the Insights button, Excel will take a moment to analyze the data set and then present you with several graphical choices (Figure B). The quality and quantity of those choices will depend on the data being analyzed, of course. In our simple example, the choices are fairly basic and not really all that enlightening.
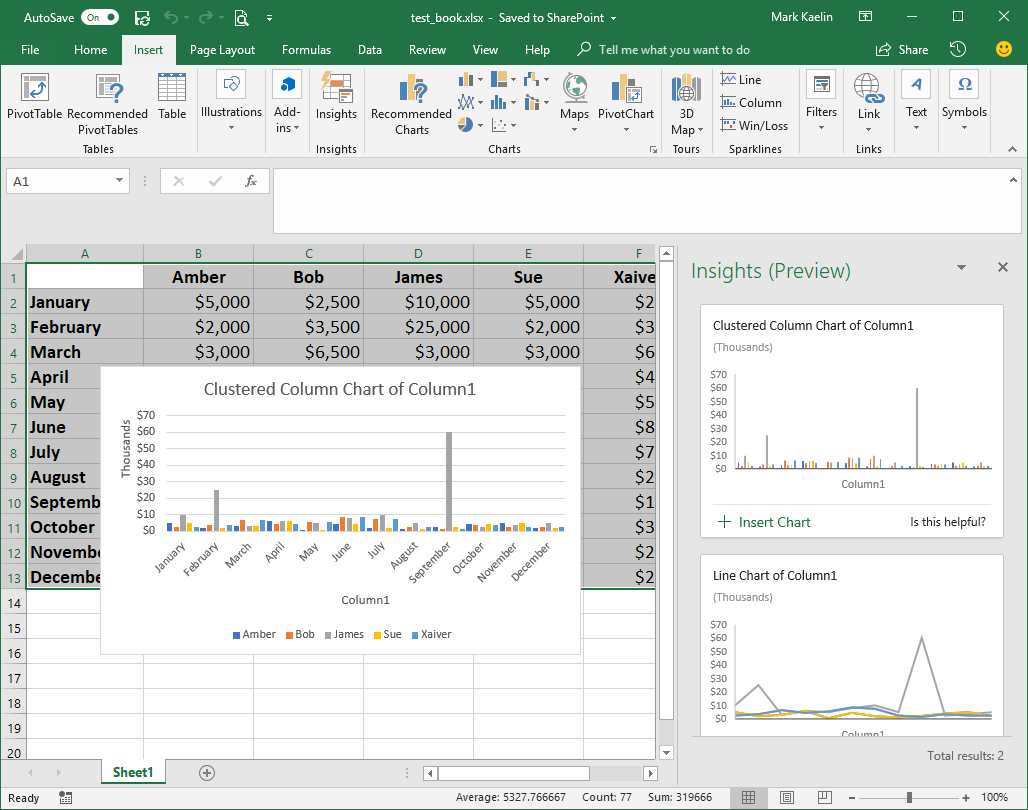
Assuming you find a graph that meets your needs, you can click the Insert Chart link and the chart will be inserted into your workbook already formatted in presentable, albeit rudimentary, form (Figure C).
Caveats, warnings, and admonitions
It is important to realize that Insights works best with clean, well-organized data that is free of nesting and blank rows and columns. Equally important, this tool cannot be used on data that has been converted into a Pivot table. However, according to Microsoft, Insights will work best with data that has been formatted as an Excel Table (Figure D).
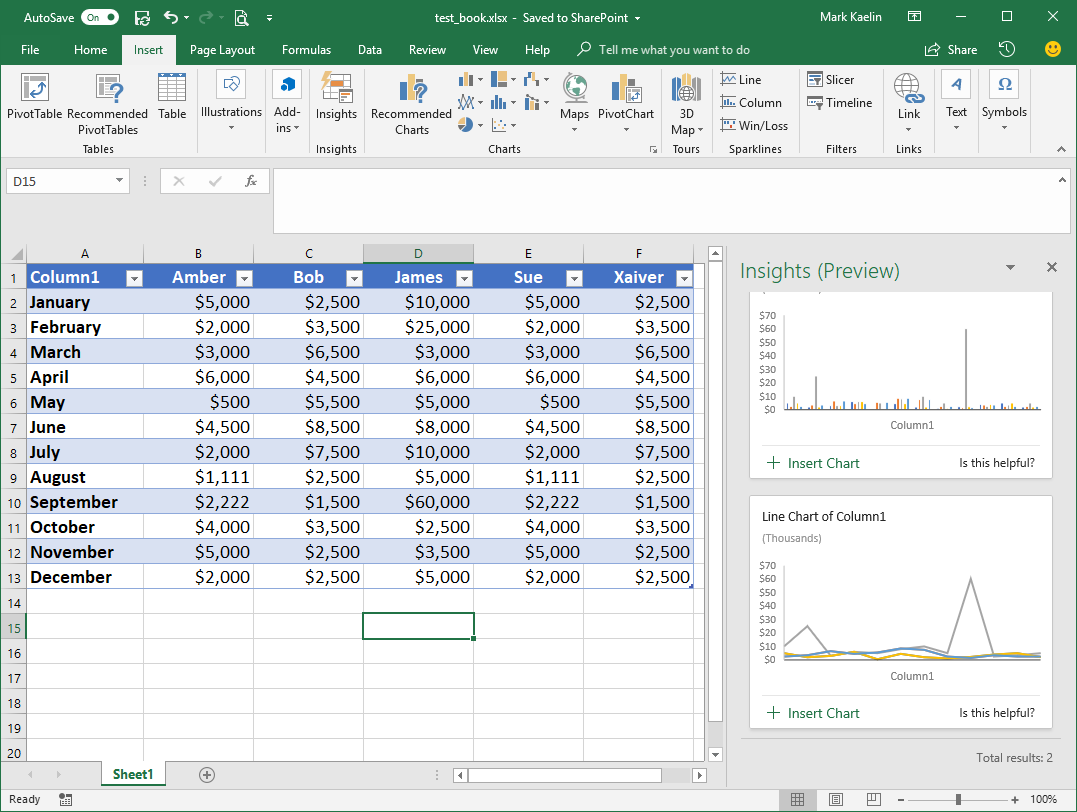
To format a data set as an Excel Table, highlight the data and use the CTRL-T keyboard shortcut. Although, in our example, converting to the table format offered no additional chart choices or hidden pattern revelations, it may be more effective on a more complicated table.
And therein lies the problem with Insights and any other tool designed to use AI or machine learning–they don’t always work. Proponents of these new technologies tend to overstate the true capabilities of AI and machine learning. I tried Insights on several sets of real Excel data and the tool could not even produce one chart.
SEE: How to use Excel’s what-if tools to analyze business scenarios (free PDF) (TechRepublic)
Let’s take a look at our sample data set. Obviously, James is associated with several huge spikes in activity and the charts do reveal it, but did we really need Insights to see it? And, of course, the tool can do nothing to explain why the activity spiked. The reasons will have to be explored by a person, AI cannot help us in that regard.
The limited overall capability to what any AI tool can do in a practical setting is important to keep in mind as they become more prevalent and the hype surrounding them becomes louder. While AI may be able to provide a clue toward a pattern or a solution, comprehending the meaning and the significance of that pattern is still going to be the responsibility of a human being for a long time to come.
Also read:
- Microsoft 365: A cheat sheet (TechRepublic)
- Artificial ignorance: The 10 biggest AI failures of 2017 (TechRepublic)
- Microsoft contemplates the ethical and societal impact of artificial intelligence in new book (TechRepublic)
- Elevate your Excel skills to pro level with this Microsoft-approved training (TechRepublic)
- Microsoft’s AI journey beyond Office (ZDNet)
- Microsoft adds more AI-powered updates to Bing, Cortana, Office 365 (ZDNet)
Your thoughts:
Are you using AI for data analysis? How effective is it? Share your thoughts and opinions with your peers at TechRepublic in the discussion thread below.