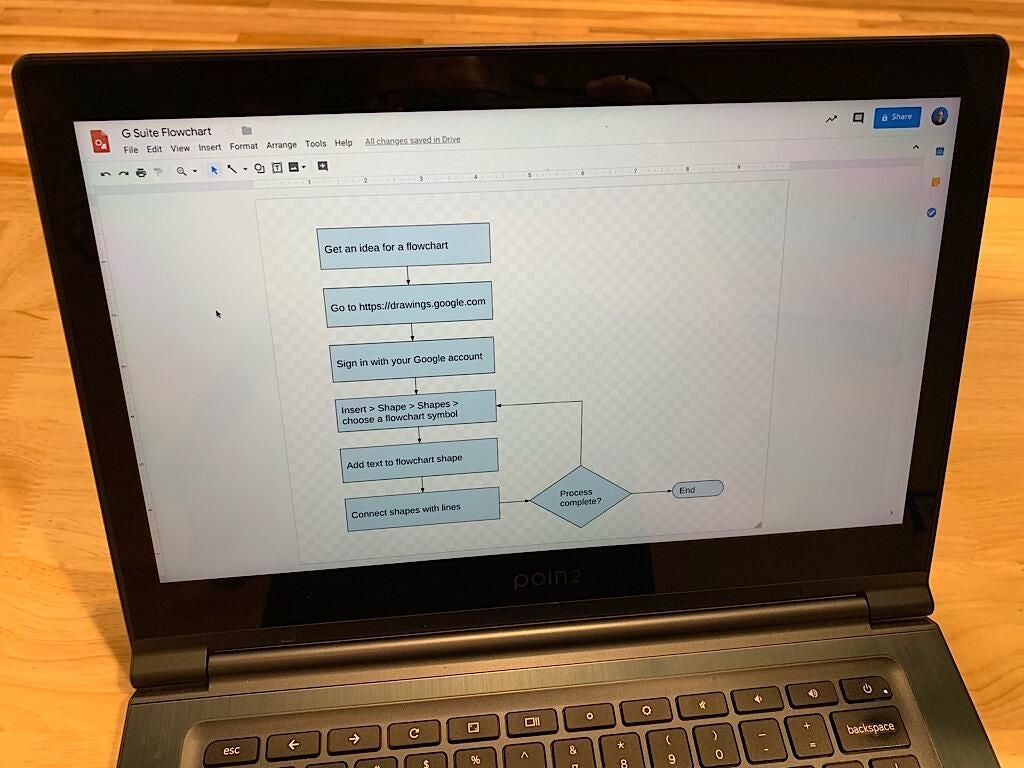
Flowcharts and diagrams can help people understand a process, see a sequence of events, and visually represent relationships. A flowchart shows steps in a sequence, which typically start at the top (or left) of a chart and progress to the bottom (or right). For example, a rectangle indicates a step that changes data, while a diamond represents a decision. A diagram shows a set of relationships among items, such as a timeline or chart.
Within G Suite, Google Drawings lets you create flowcharts, diagrams, charts, and more. Once complete, you can export a Google Drawing as an image, which you may then insert into a Google Docs, Sheets, or Slides file. Optional third-party add-ons offer access to additional flowchart and diagram-creation tools.
SEE: G Suite: Tips and tricks for business professionals (free PDF) (TechRepublic)
Here’s how to create flowcharts and diagrams within G Suite, along with a look at how to insert these drawings into other G Suite apps.
Google Drawings
In Chrome on a laptop or desktop, go to drawings.google.com to create a new drawing. Or, from drive.google.com, choose New | More | Google Drawings. Once you have a Google Drawing, you can build your flowchart.
How to add flowchart shapes in G Suite
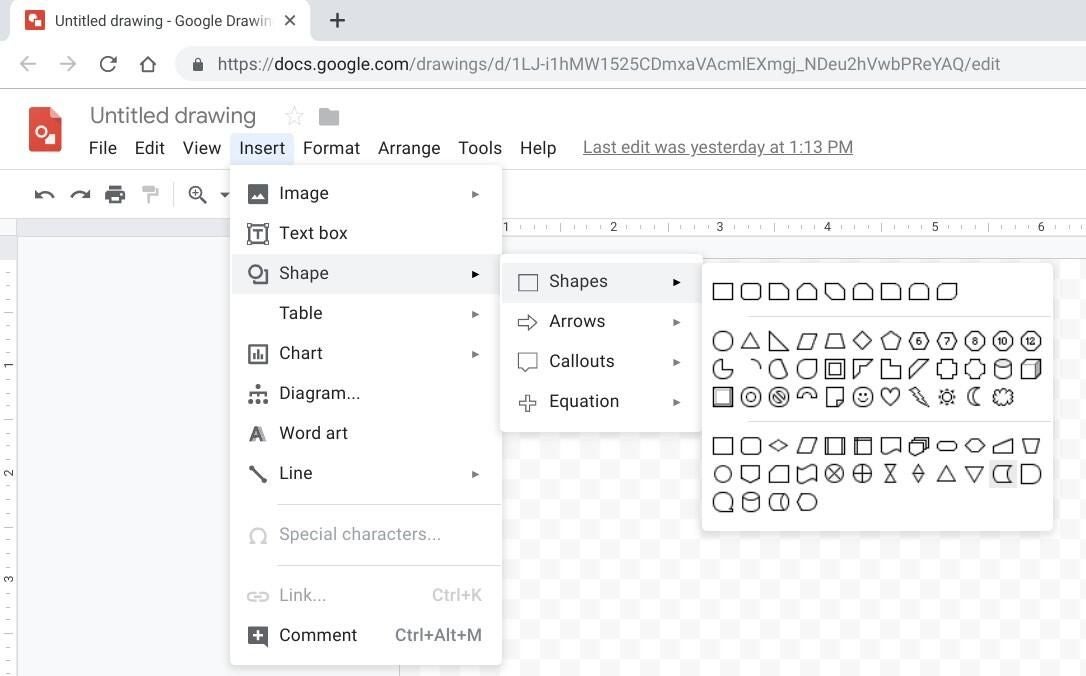
Choose Insert | Shape | Shapes to select and add from several pre-made shapes (Figure A). Grouped into three sets, the 28 flowchart symbols display in the lower-portion of the available items. Move the cursor over each shape, and the name of the shape will display. For example, the first few flowchart symbols indicate Flowchart: Process, Flowchart: Alternate Process, Flowchart: Decision, and Flowchart: Data.
Figure A

How to add flowchart text in G Suite
Double-click (or double-tap) on a shape, and then type text to identify each step in your process. On decision steps, you may also want to select Insert | Text Box, and then add text next to each potential decision path (e.g., add a Y or N, or Red, Blue, Green, etc.).
How to connect shapes with lines
Go to Insert | Line and then select the line with an arrow to indicate the sequence of events. When the line element is selected and active, dots will display at the corners (or sides) of shapes as the cursor moves over a shape. Click (or tap) on one of these dots, and then–while still holding down your mouse button, touchpad, or finger on the screen–drag the cursor to another shape. Again, dots will display on the corners (or sides) of the second shape. Move the cursor to one of these dots, and then release the button or lift your finger from the touchpad or screen. You’ve created an arrow between two flowchart shapes to show the sequential relationship between two steps.
Repeat the above steps as needed to complete your flowchart.
How to create a diagram in G Suite
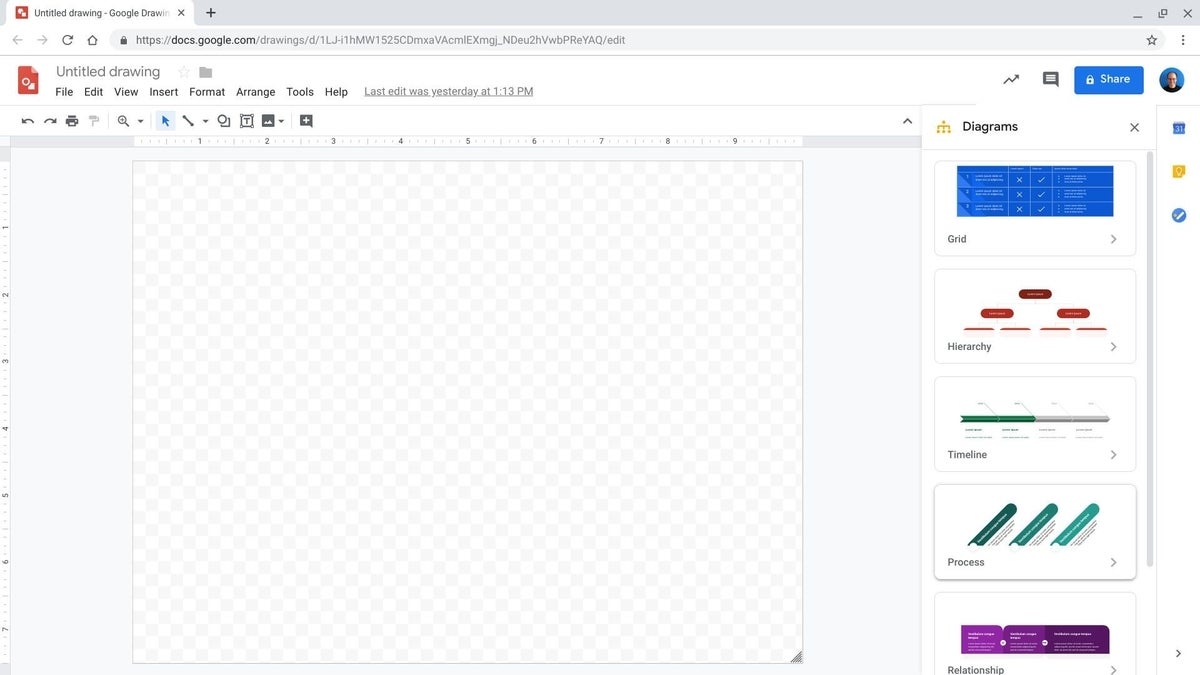
In both Google Drawings and Google Slides, you also might explore the Insert | Diagram menu options. Google offers six types of diagrams: Grid, Hierarchy, Timeline, Process, Relationship, and Cycle (Figure B).
Figure B

You can choose from between four and eight diagram styles, depending on the diagram type selected. Unlike a flowchart, these diagrams typically show a single process without alternative routes.
Flowchart, diagram, and chart add-ons
Google Docs, Sheets, and Slides each allow third-party add-ons. With a file open in any of these apps, choose Add-Ons and then Get Add-Ons to review the available enhancements. You can also enter a keyword (or keywords) to search the available add-ons.
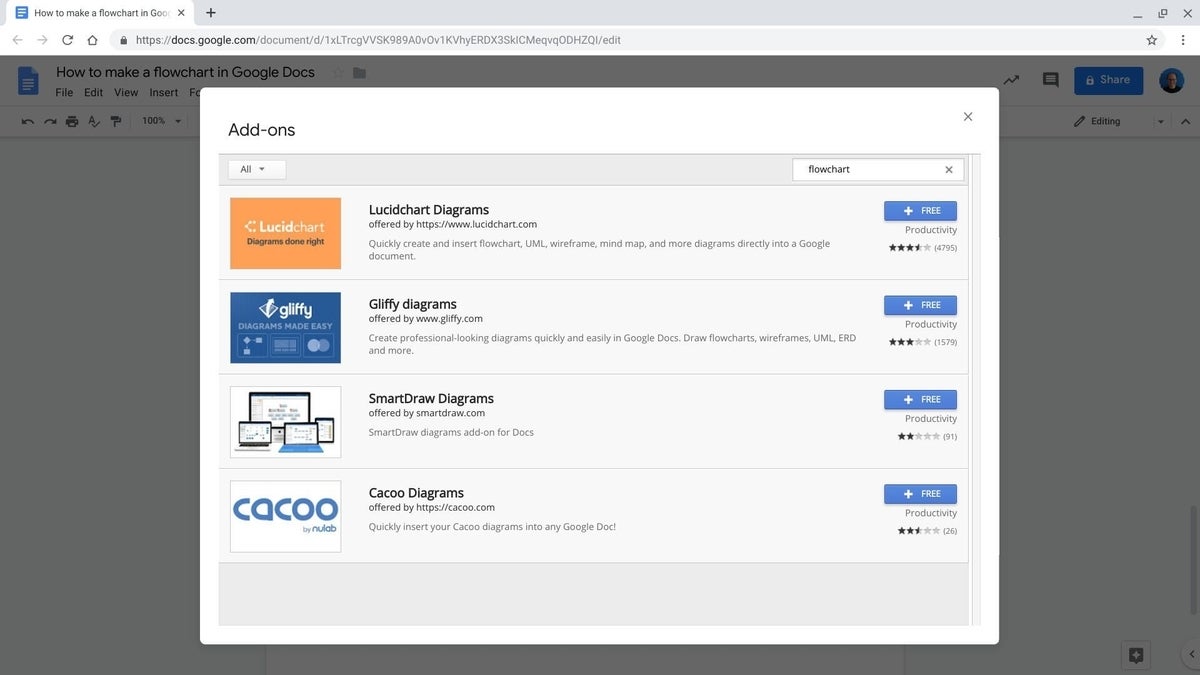
For example, within Google Docs, choose Add-Ons | Get Add-Ons and then type Flowchart in the search box and press Enter. As of May 2019, you’ll see four add-ons: Lucidchart Diagrams, Gliffy Diagrams, SmartDraw Diagrams, and Cacoo Diagrams (Figure C).
Figure C

Add any of these to gain access to the respective service’s flowchart and diagram creation features. Note: If you use G Suite at work or school, a G Suite administrator may restrict or manage access to add-ons.
Lucidchart offers an add-on for all three of the core Google Docs apps: Lucidchart Diagrams for Docs, Lucidchart Diagrams for Slides, and Lucidchart Diagrams for Sheets. Within each of these apps, when you have a file open, choose Add-Ons | Get Add-Ons and then search for Lucidchart. Organizations that consistently create complex charts and diagrams might purchase a Lucidchart license for people in the organization.
SEE: Create an org chart or a diagram in minutes with Lucidchart (TechRepublic)
Your experience?
Do you create flowcharts or diagrams within G Suite? If so, have you used third-party add-ons or apps, such as those from Lucidchart or Gliffy, to add functionality to Google Docs, Sheets, or Slides? Let me know what your experience has been, either in the comments or on Twitter (@awolber).
