


If you have used Task Manager in previous versions of Windows, you know it’s packed with features that can help you use and troubleshoot the Windows operating system. When Microsoft developed Windows 8, it gave Task Manager a serious and long overdue update–and those same enhancements are available in Windows 10. Let’s take a closer look.
Getting started
The quickest way to get to Task Manager is to access the Desktop, right-click on the taskbar, and select Task Manager from the context menu. Click More Details in Task Manager to access the full tabbed interface.
Grouping processes
To make specific processes easier to find, the Processes tab in Windows 10’s Task Manager groups them by type. Figure A shows the three groups: Apps, Background processes, and Windows Processes. Each group contains a list of the pertinent processes. If you do not see the grouping feature, access the View menu and select the Group By Type option.
Figure A
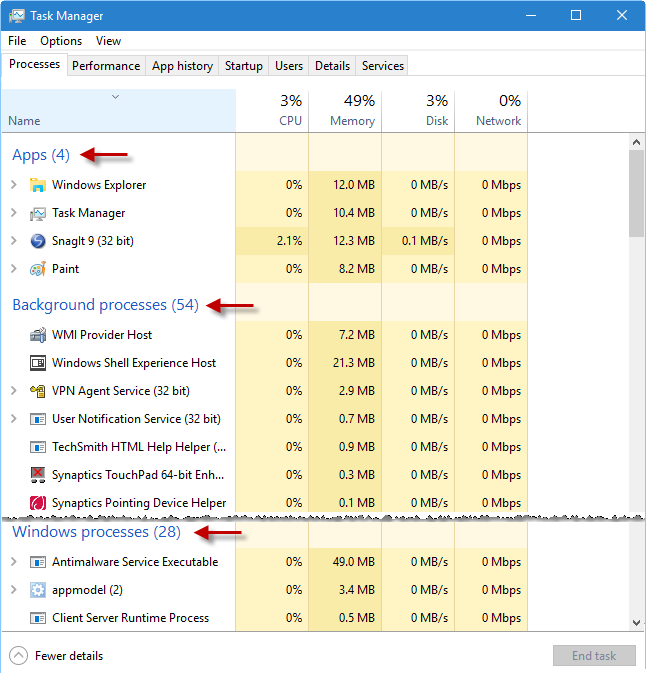
To make specific processes easier to find, processes are grouped by type.
Note that although the first group is titled Apps, it includes processes associated with standard Windows applications as well as Windows Store apps.
As you can imagine, if and when you need to kill a process, having them in these groups will make it easier for you to quickly and safely find the process that you need to eliminate.
SEE: Investigating Windows 10’s Task Manager: More simplicity, more power
Additional counters
In previous versions of Task Manager, the main focus of the Processes tab was the CPU and Memory counters. While those counters provide you with a good start, they aren’t the only thing you may want to track when troubleshooting a problem. Heavy disk access or heavy network access can be just as big a performance drain as heavy CPU or heavy memory access. To give you a more complete picture of what is happening in the system at any one point in time, Task Manager offers columns for Disk and Network counters on the Processes tab, as shown in Figure B.
Figure B
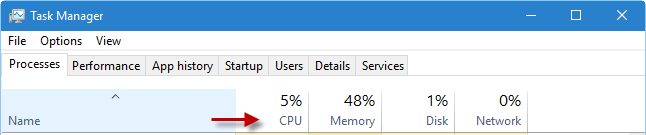
The Processes tab includes counters for Disk and Network.
Along with the column names, the top row also displays a percentage counter indicating the overall usage for each of the main resources. For example, in Figure B you can see that the current overall usage for the CPU is 5% and the overall usage for Memory is 48%. The Disk is at 1% and Network usage is at 0%.
You’ll also notice that the counters are the main focus of the Processes tab–the only other information displayed by default are the names of the process and their status. However, if you want to see the Status or PID (Process ID), you can add those column (and others) to the display. Just right-click the header and select the desired columns from the context menu, shown in Figure C.
Figure C
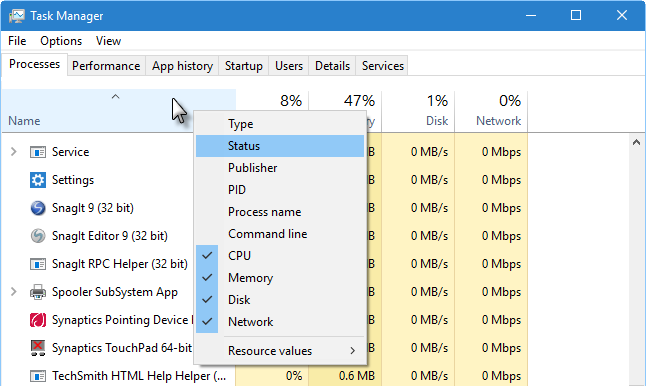
You can add other columns to the Processes tab.
Heat map
One of the most outstanding features on the Processes tab is the heat map technology. In earlier versions of Windows, you’d sort the CPU or Memory column in descending order to determine which applications were consuming more resources than expected. You can still sort the columns in Windows 10’s Task Manager, but you don’t have to: The heat map technology built into the Processes tab uses color coding to let you instantly identify which applications are sucking up system resources. The more resources being used, the darker the background color.
Figure D shows a heat map generated by copying an 8 GB folder across the network. This heat map shows all the colors. Disk activity for Task Manager is 0%–and light yellow indicates no activity. Looking at the heat map for Windows Explorer, you can see that dark yellow indicates moderate activity (CPU at 1.3% and Memory at 36.4 MB); light orange indicates heavier activity (Disk at 10.0 MB/s); and dark orange indicates very heavy activity (Network at 83.9 Mbps). The overall value for Network is at 97%. The rose red indicates extremely heavy activity for the Network category.
Figure D
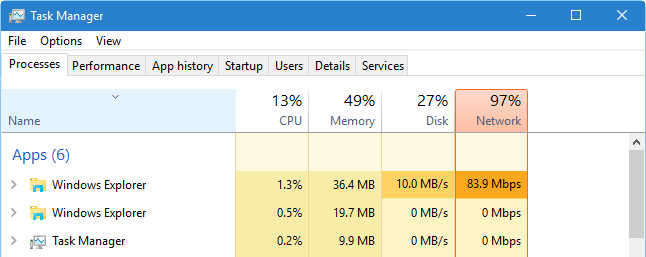
This heat map was generated by copying an 8 GB folder across the network.
With the heat map technology and the addition of Disk and Network counters, you can monitor activity across multiple resources (CPU, memory, disk, and network) at the same time, without having to sort the data. You can also find the hot spot instantly without having to read specific units.
Must-read Windows coverage
- CrowdStrike Outage Disrupts Microsoft Systems Worldwide
- 10 Best Project Management Software for Windows in 2024
- Windows 10 Extended Security Updates Promised for Small Businesses and Home Users
- Securing Windows Policy
Process details
Another thing that makes using Windows 10’s Task Manager easier is that process names and their icons are friendlier. Names are in plain language instead of cryptic terms and the icons are more representative of the process. For example, under Background processes you’ll find the Spooler Subsystem App, which is still a bit cryptic–but way better than just spoolsv.exe. Along with the printer icon, it’s clear that this process is the print spooler or print queue. If you need more information on any process name, right-click on it and choose Search Online from the context menu, as shown in Figure E. Your default browser will open to a search results page with information about the process.
Figure E
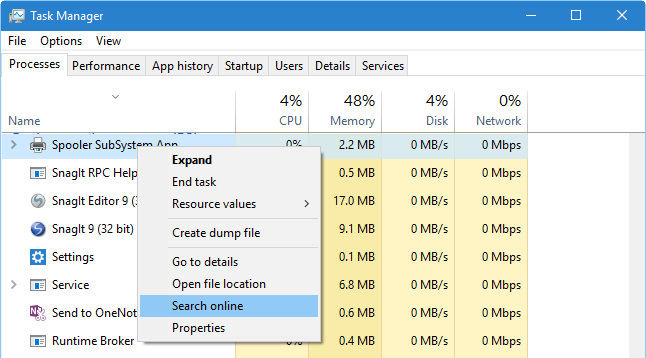
While process names and their icons are now friendlier, you can use the Search online feature to easily learn more about a process.
If you miss the old Processes display, just select the Go To Detail command from the context menu and you’ll see the Details tab, as shown in Figure F.
Figure F
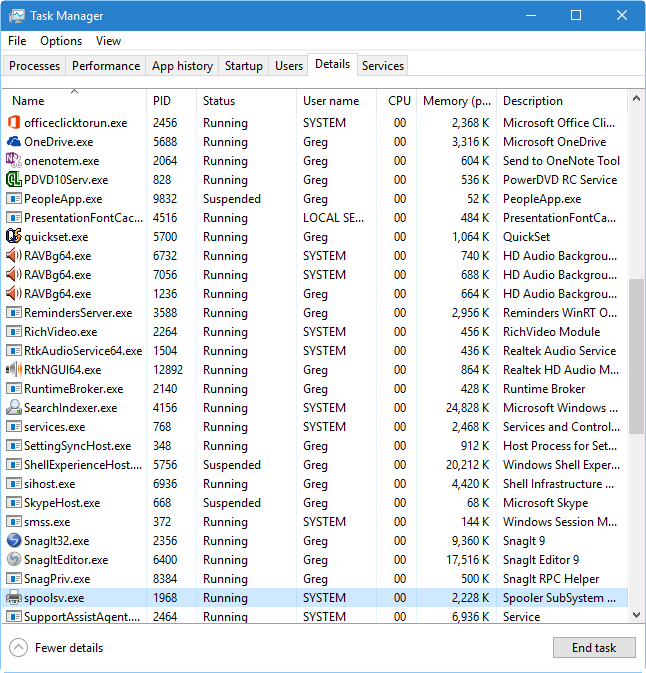
The Details tab looks pretty much like the old Processes tab.
If a process involves more than just the main process, you can expand it to get more detail on what’s running under it. For example, if you look back at the heat map in Figure D, generated by copying an 8 GB folder across the network, you’ll see that there are two Windows Explorer icons. Each has an arrow adjacent to it indicating that the main process has subprocesses running under it. Figure G shows that process expanded to show the whole procedure: I’m copying a folder from My Pictures from one computer across the network to the Testing folder on the Windows 10 system. The copying operation is 11% complete.
Figure G
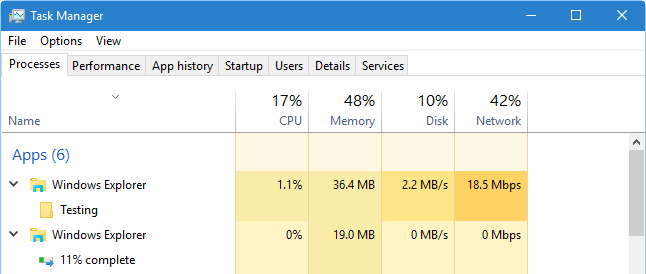
If a process has more to it than just the main process, you can expand that process to get more detail on what is running under that process.
As I mentioned earlier, the overall usage values for the CPU, Memory, Disk, and Network listed at the top of the Processes tab are shown as percentages by default. Now, for each process, the CPU counter is the only counter shown as a percentage. The other counters show an actual value. For example, in Figure G the counter for Windows Explorer shows 1.1% for the CPU, 36.4 MB for Memory, 2.2 MB/s for Disk, and 18.5 Mbps for Network.
If you want to view the Memory, Disk, or Network as percentages, you can change any one or all of them to percentage values. To do so, right click on any row, choose Resource Values from the context menu, select any counter, and then choose Percents, as shown in Figure H.
Figure H
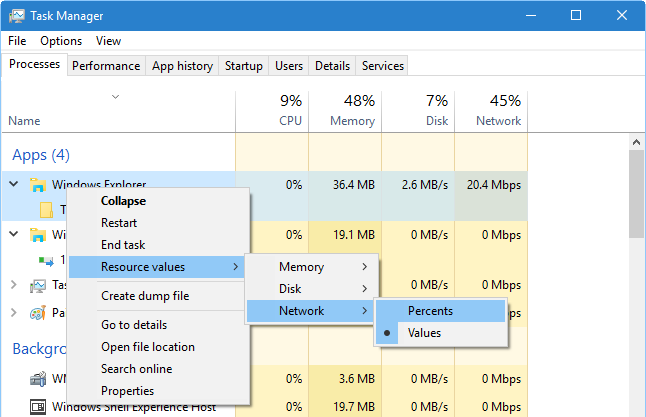
You can change the counter for Memory, Disk, or Network to display as percentages.
What’s your take?
Have you been in a troubleshooting situation where the features on the Windows 10’s Processes tab really helped you? Share your experiences and advice with fellow TechRepublic members.