
Creating graphs is easy — grab your favorite spreadsheet\r\nprogram, enter some data, and use the chart wizard. What’s more difficult is creating\r\nthose graphs to be published on the web based on dynamic data. Plenty of\r\noptions are available to graph hard-entered data, but few are capable of\r\ndynamic generation.
In this edition of Five Apps, we take a look at five free\r\nweb-based tools for creating different types of graphs from dynamic data. Each\r\nof these apps offers a vast number of options and lots of customizability, more\r\nso than I could possibly demonstrate here. So take a look at each webpage and\r\nbrowse through the examples provided to see the power of each of these tools.
Note: This gallery is also available as an article.
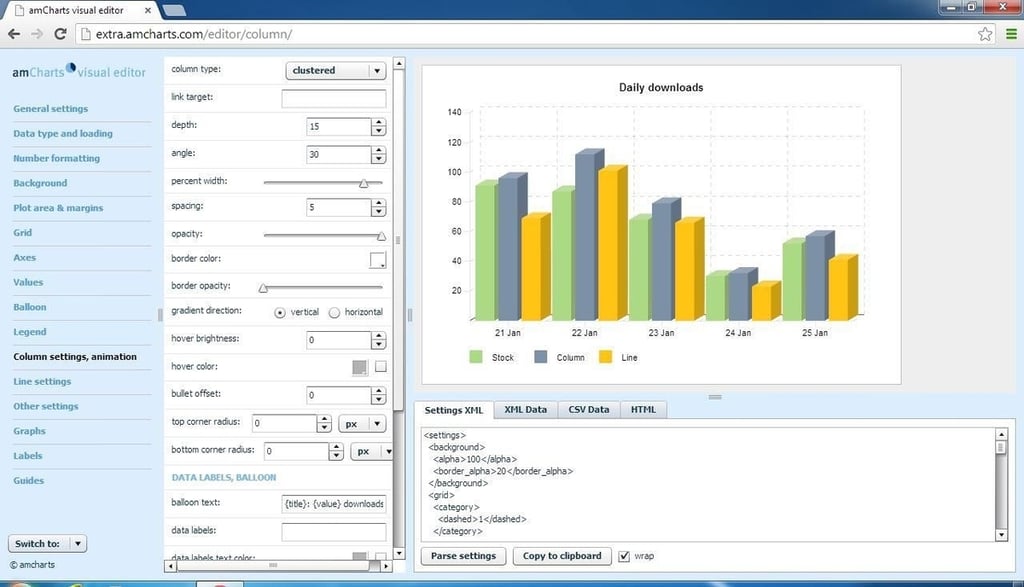
Here are some additional settings available in the\r\neditor. Settings can be maintained\r\nvia the XML tab in the bottom left, for advanced chart creators.
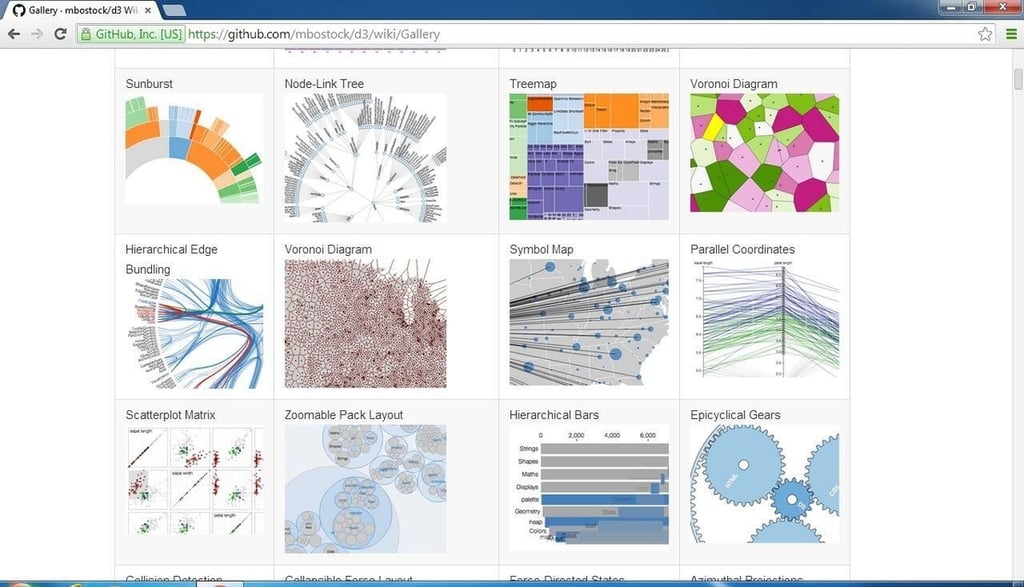
D3.js also supports many specialized chart types\r\n\u2013 in reality, it supports anything someone wishes to create because it is a\r\ncomplete DOM framework.
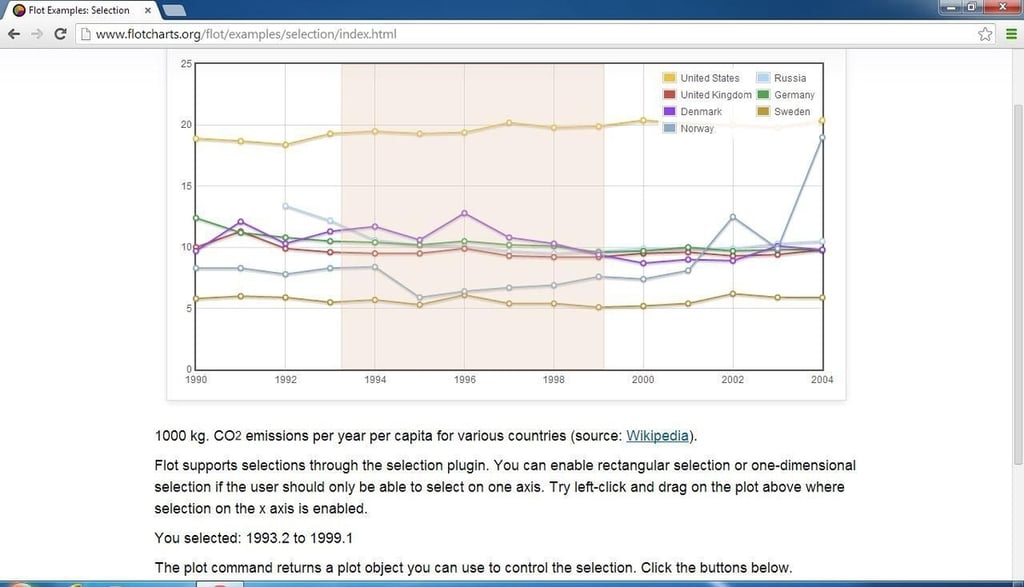
Another advanced feature of Flot is selection\r\nand zooming. You can click and drag\r\nwith the mouse to select a range of data and then optionally zoom into that\r\nselection.
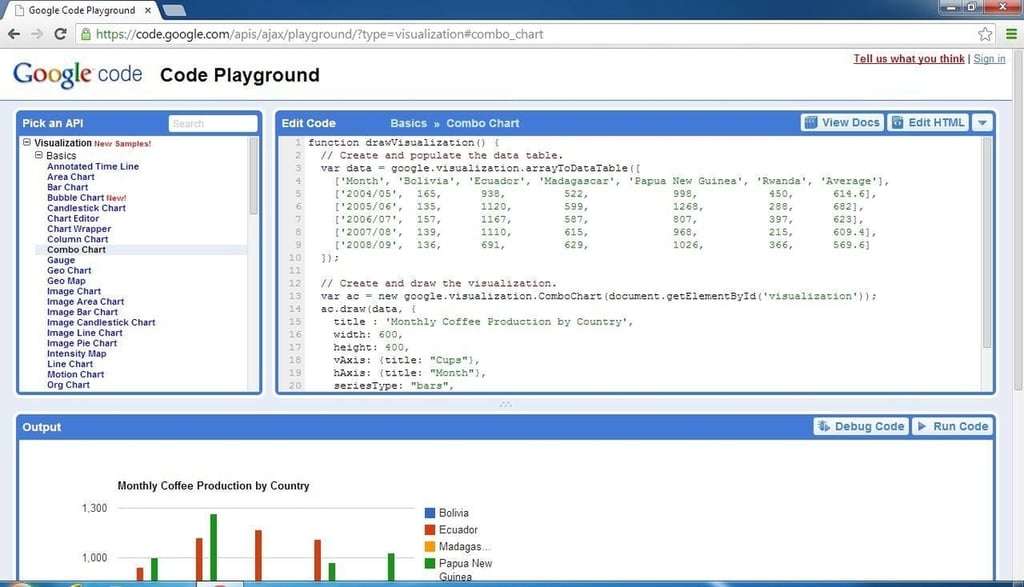
The Google Code Playground can be used to design and build\r\nyour charts and graphs and then see the results instantly.
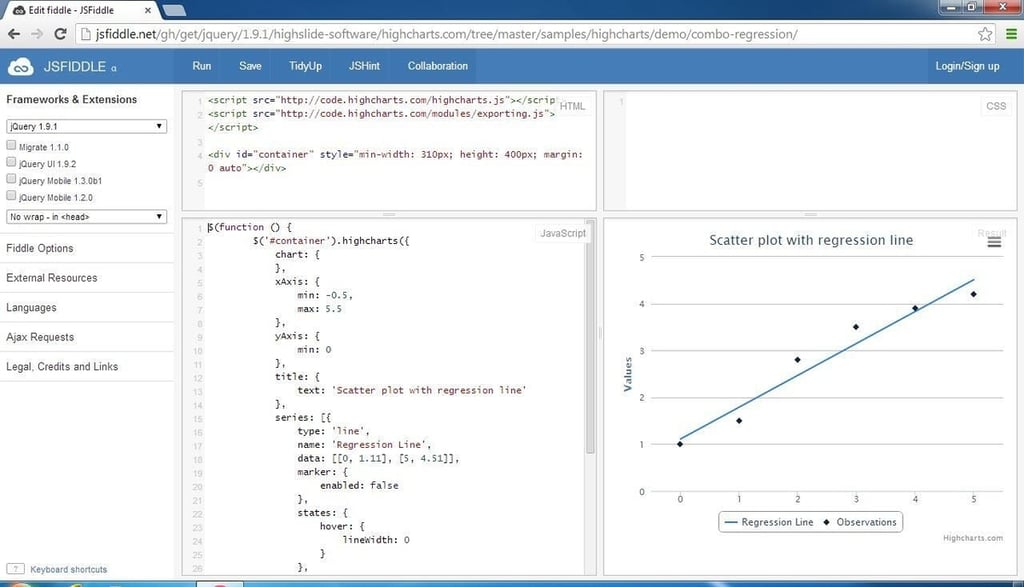
HighCharts links to jsFiddle for design, creation, and\r\ninstant feedback.


