


If you want to drill into your data to understand trends, outliers and the details of what’s going on, you want all the visualization and query options that are in Power BI. But when the time comes to explain that to someone else or use it to help make a decision together, how do you show them the reports?
SEE: Here’s everything you need to know about Microsoft Power BI.
A common way people share and explain data is in PowerPoint presentations with graphs and charts or screenshots of a Power BI report. The problem is that you can’t dig into the data to see what’s going on, and it won’t update as new data arrives unless you do it yourself.
Jump to:
- Adding Power BI reports to PowerPoint
- Dive into and share Power BI data through PowerPoint
- How to set up Power BI reports and alerts through email
- Accessing and creating Power BI reports in the Office Hub
- Using Power BI in Outlook
Adding Power BI reports to PowerPoint
The new Power BI data storytelling add-in for PowerPoint lets you insert fully interactive, live Power BI reports onto a slide. To do so, copy a Power BI report’s URL into a special PowerPoint placeholder.
If you have a Microsoft 365 license, the Power BI button should appear on the Insert ribbon in PowerPoint. Click to get the Power BI placeholder shown in Figure A, and then paste it into the URL of the report.
Figure A
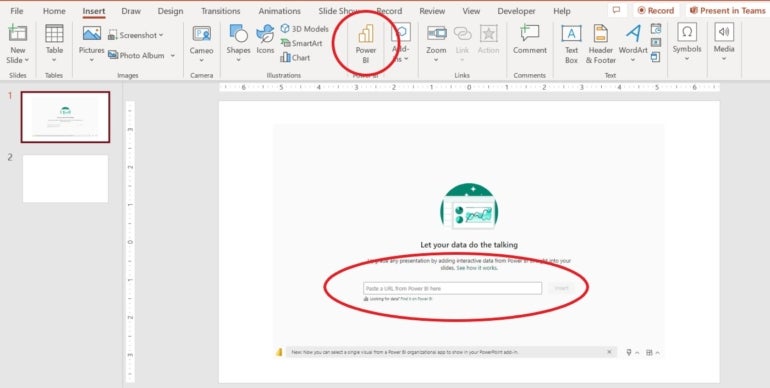
You’ll need to get the report URL from Power BI as follows:
1. In Power BI, select the report.
2. If you want a specific configuration, apply a filter or slicer. This step isn’t necessary — it depends on the report you’re after.
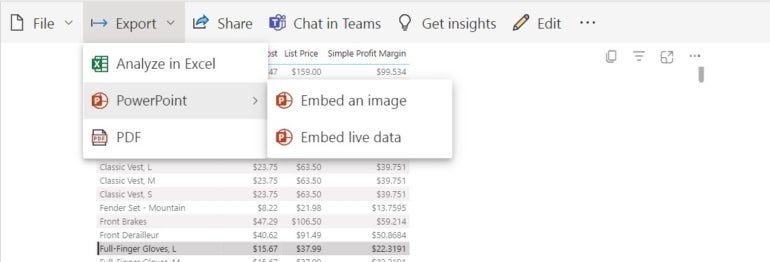
3. Choose Export.
4. Choose PowerPoint from the resulting dropdown.
5. Choose Embed live data from the next dropdown (Figure B). If you don’t want an interactive report on the slide, choose Embed an image instead. This option is helpful if you’re not online during the presentation.
Figure B
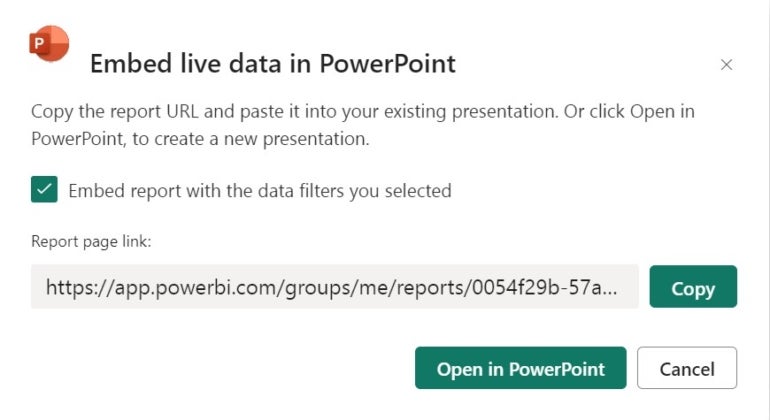
6. Power BI will give you the option to add the report to an existing presentation or create a new one. Choose the appropriate route for your situation.
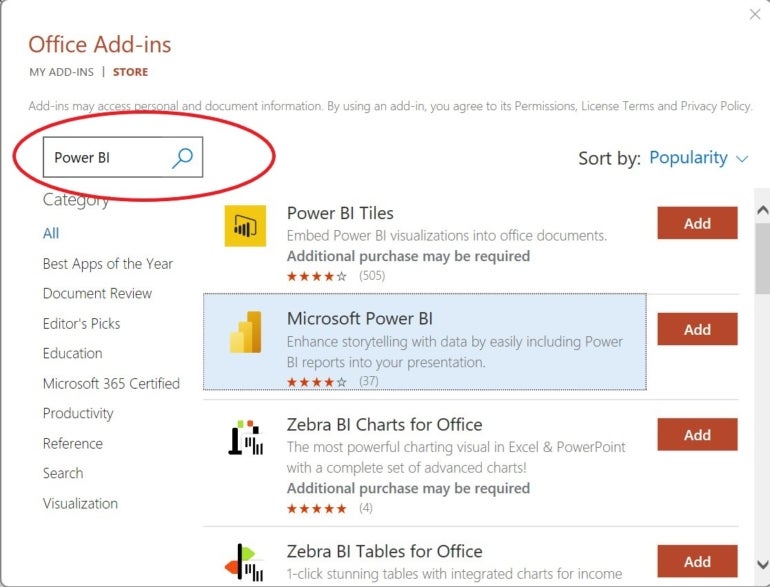
If you don’t see the Power BI option in PowerPoint, choose Get Add-ins from the Insert tab and search for Microsoft Power BI (Figure C).
Figure C
Dive into and share Power BI data through PowerPoint
If you’re giving a presentation, you can stop and dive into the Power BI data on your slide to answer questions using the same filters, slicers and tools you have in Power BI on the web as long as you’re online, as the add-in is a WebView2 control.
SEE: Learn about Microsoft Power BI’s default drilling.
If you’re sending the slides to someone, they’ll need to have access to the Power BI report to see that slide. You can set that up when you use Share to get the report URL (Figure D). If they don’t have access, they just see a notification that lets them ask for access.
Figure D
How to set up Power BI reports and alerts through email
More about Software
- Software Installation Policy
- Five Methods to Insert a Checkmark Into Microsoft Office Products
- How to Hide and Handle Zero Values in an Excel Chart
- How to Use Section Breaks to Control Formatting in Word
Slides aren’t the only place that we need to use data to ask questions or explain what we’re planning to do. A lot of people still have conversations and share information through email, especially to send regular status reports. Fortunately, there are several ways to use Power BI with Outlook.
When you share Power BI reports and dashboards using the Share button on the service, you can email a link. Note that people outside of your organization can see but not edit reports. You can also subscribe to get snapshots of Power BI reports and dashboards by email if you have a Power BI Pro or Premium license. To do so:
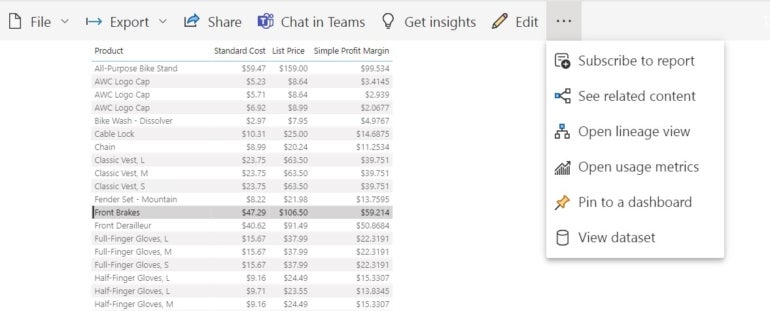
1. Click the More options button (the three ellipses).
2. Choose Subscribe to report from the dropdown (Figure E). If there are no subscriptions, you’ll need to click Create a subscription to continue.
Figure E
3. Enter an email address (Figure F).
Figure F
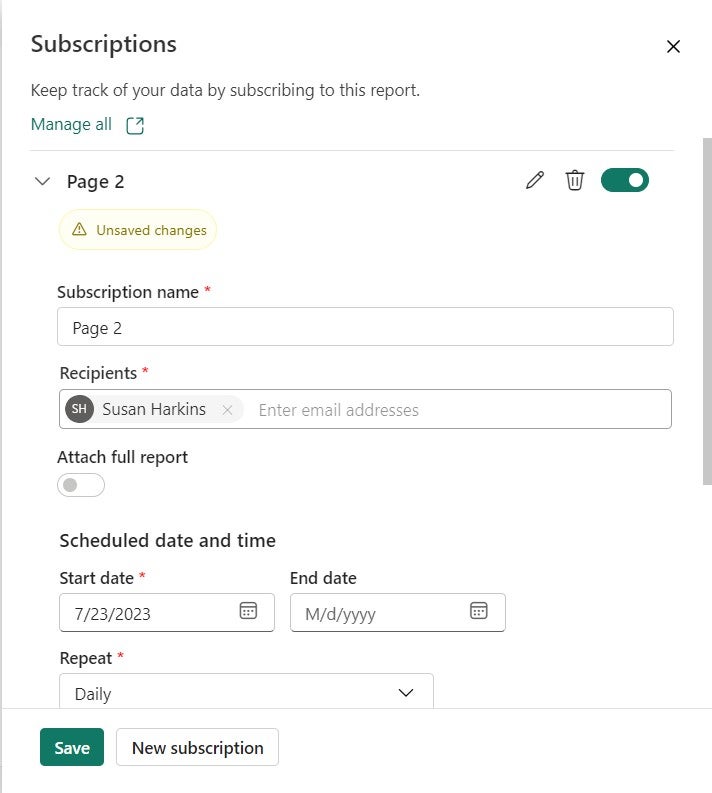
4. Choose how often to send the mail.
5. Click Save, and close the subscription pane.
If you want to email a report when something changes rather than at regular intervals, set up Power BI data alerts and choose Use Microsoft Power Automate to trigger additional actions.
If you want to send Power BI reports out by email regularly as attachments, you can automate that with Power Automate. Create a flow and set how often you want to send the reports and what format (like PDF) you want to send them in.
Accessing and creating Power BI reports in the Office Hub
The Office Hub, which is both the office.com website and an app on your PC, now supports Power BI reports on the list of documents you can create. You can also add the same Power BI app you use in Teams to the list of apps that appear there, similar to Outlook (Figure G).
Figure G
Using Power BI in Outlook
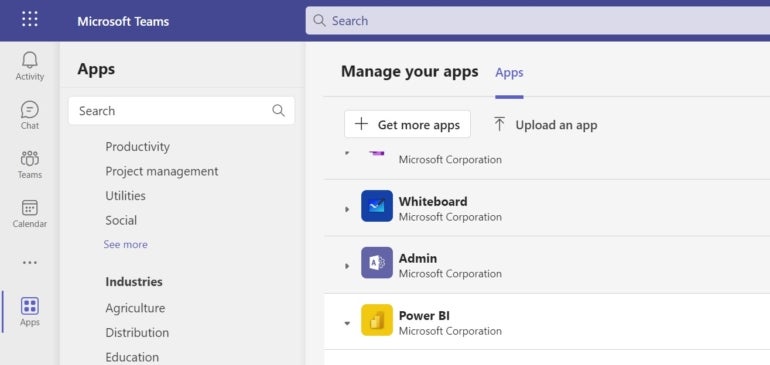
If you’re using Outlook on the web or on Windows and you have the Power BI app installed in Teams, the Power BI app will also appear in the Outlook Navigation pane along with Microsoft To Do, Yammer, Bookings and others (Figure H). This is currently rolling out as part of the Microsoft 365 First Release for Outlook web and Office Insiders Beta Channel for Outlook on Windows, but that can take some time to reach everyone, even if other people in your tenant have it already.
Figure H

This lets you explore reports and dashboards without needing to switch to another application. Right-click a report to open it in a new window rather than switching views.
Having Power BI in a second window or another tab, even if it’s more convenient to get to than a separate website, isn’t integrated into the emails you write. When you get the Power BI app in Outlook, you’ll be able to insert a report in an email as if you were attaching a file, with a similar picker that shows the reports and dashboards you’ve used recently. And it lets you search for ones that don’t appear on the list. That doesn’t embed the report into the email though; what you get is an Adaptive Card, which Microsoft is now also calling Preview Cards.
SEE: Also learn how to export Microsoft Power BI data to a Microsoft Excel file.