


Grouping records by dates or time is easy in Microsoft Excel, but it doesn’t make a great report. For instance, a simple sort by the date or time column will group records, but it will be difficult to read.
The article How to use a border to discern groups more easily in Microsoft Excel offers a quick and easy method for coloring borders between groups. It’s easy and will certainly improve readability while you’re working with the data, but it’s still not a great reporting tool. In this Excel tutorial, I’ll show you how to create a PivotTable that will do almost everything for you when you need to group records by the hour for reporting purposes.
More about Software
- Software Installation Policy
- Five Methods to Insert a Checkmark Into Microsoft Office Products
- How to Hide and Handle Zero Values in an Excel Chart
- How to Use Section Breaks to Control Formatting in Word
I’m using Microsoft 365 on a Windows 10 64-bit system, but you can use an earlier version through Excel 2007. For your convenience, you can download the demonstration .xlsx file. You should have no trouble completing the instructions in Excel for the web.
About Excel’s date arithmetic
Excel makes working with dates and times simple. If you enter a date, Excel recognizes it and formats it as a date. The same happens if you enter the date and time together. The thing to remember is that what you see and what Excel is evaluating are two different things. You see a formatted date/time. What Excel evaluates is a date serial value.
A date serial value is a numerical value that represents a date where January 1, 1900, is 1 and every day after is sequential with an increment of 1. For example, if January 1, 1900, is 1, then January 2, 1900, is 2, January 3, 1900 is 3, and so on. As mentioned, once formatted as a date, that’s not what you’ll see. If you’d like to see this at work, enter the date January 1, 1900, and apply the General format. Doing so will allow you to see the underlying serial date value, 1. Enter as many dates as you like using the General format to get a feel for this setup until you’re comfortable. Once you’re ready, continue.
How to use the Excel date data
Let’s suppose that you manage a call center, and you want to know how many calls are received every hour. This is a reasonable request because you need to make sure you’re well-staffed.
We’ll work with a simple sheet of date and time values that are stored in the same cell (Figure A).
Figure A
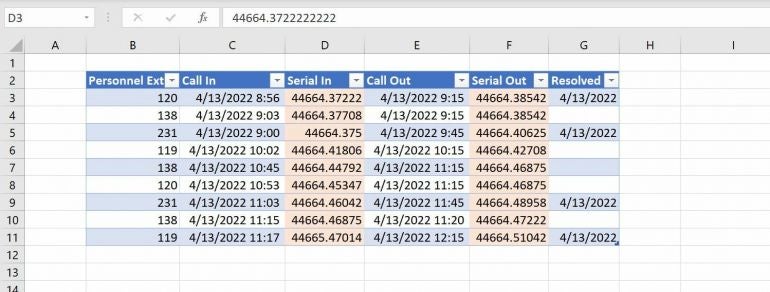
To the right of the formatted date/time values, is the same values formatted as General, just for visual information. You won’t want to include this column in your work. Each call record comprises personnel id, call in time, call out time and resolved date and time.
The first thing to notice in the General columns is that each serial date value comprises two components: The whole value represents the date, and the decimal represents the time. The time value works the same as the day value, but the decimal value represents the time of day within a 24-hour period beginning at midnight. For example, the decimal value .00 represents midnight—the beginning of a new 24-hour period, and .50 represents noon because you’re halfway through that 24-hour period.
It’s possible that you don’t know how to enter a date and time in the same cell. It’s simple, but not something you’d guess off the top of your head. In the same cell, do the following:
- Press Ctrl + ; to enter the current date.
- Press the spacebar to enter one space character.
- Press Ctr + Shift + ; and press Enter.
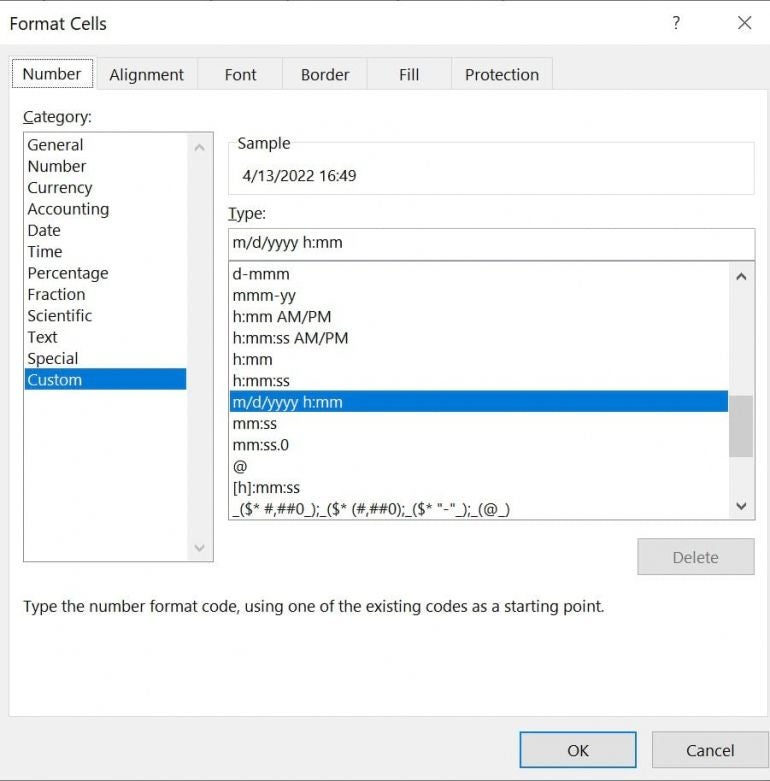
If Excel doesn’t display the entry as a date, apply a date format as follows:
- Select the cell that contains your combined date and time value.
- Click the Number’s group dialog launcher.
- In the resulting dialog, choose Custom from the Category list.
- Select the m/d/yyyy h:mm format (Figure B). If it isn’t available, enter it.
- Click OK.
Figure B
The easiest way to group is by a simple sort by the Call-In time values, but the problem with a sort is that it doesn’t count anything, and we want an hourly count. A PivotTable can group and display all the records in a reasonable report.
How to use an Excel PivotTable
Excel’s PivotTable objects have been around for a while, and they are a great reporting tool, either when printing or displaying information via a dashboard. In our case, we want a simple count of calls by the hour. We don’t need to know the personnel who made them or how quickly the issue was resolved.
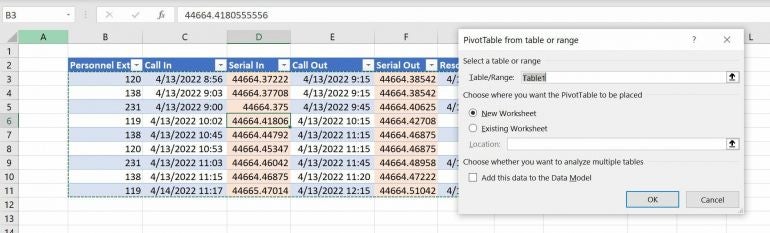
To insert an Excel PivotTable that will display hourly call counts, do the following:
- Click anywhere inside the data range or Table object.
- Click the Insert tab.
- Choose PivotTable from the Tables group. If prompted, choose Table/Range. Figure C shows Excel’s settings. They’re just what we want, so click OK.
Figure C
At this point, you have a blank PivotTable frame. Using Figure D as a guide, drag the fields down to the appropriate lists. If the PivotTable Fields pane isn’t visible, click inside the empty frame. If that doesn’t work, click the contextual PivotTable Analyze tab and then choose Field List from the Show group. Figure D also shows the resulting PivotTable. If you want to see the time for each call, expand the hour values (Figure E).
Figure D
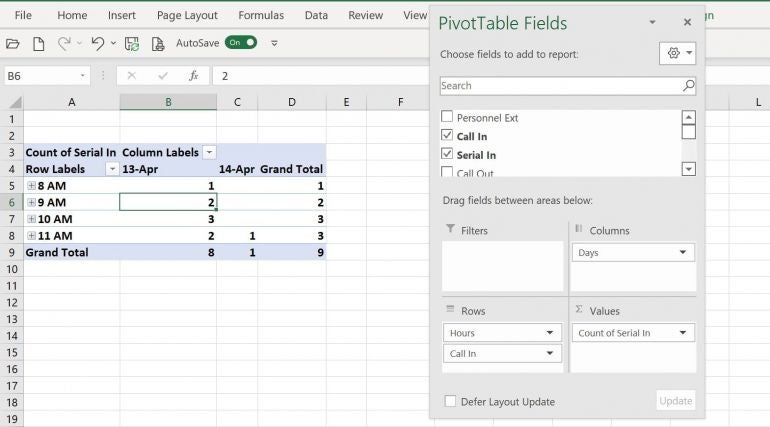
Figure E
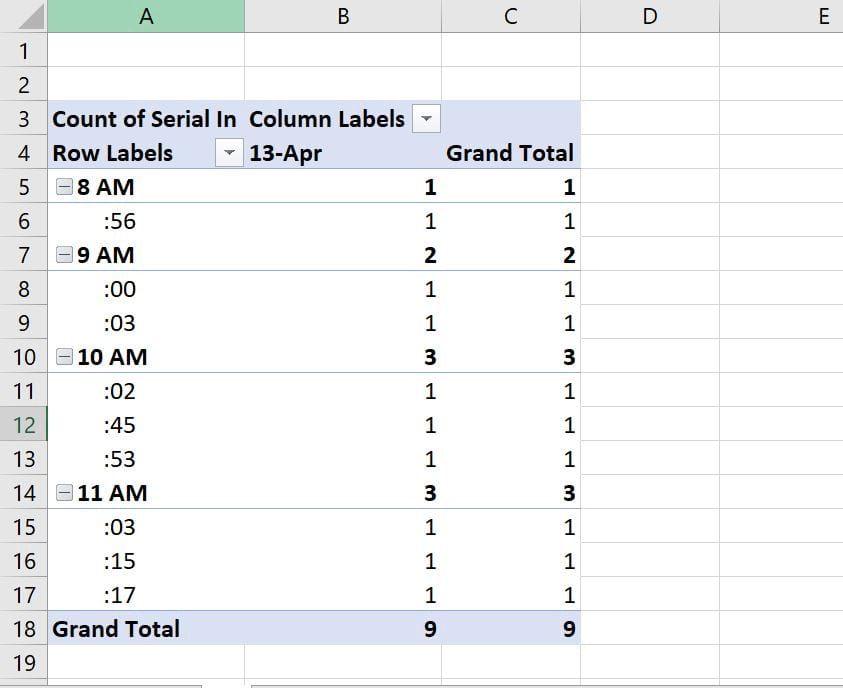
When you drag date/time values to a list, Excel performs a bit of magic for you by anticipating your needs and breaking those values into more appropriate fields, such as day, hour, and so on. So, that’s where they came from. Excel also counts the number of Call-In values by the hour field it added. It really is a powerful and flexible tool. The resulting report required very little work or expert knowledge.
For now, we’re done. We have a PivotTable with an hourly count; the information is meaningful. Because Excel adds the days and hours fields for us, we don’t have to work very hard. Excel will add date and time fields when you include such a field in the PivotTable. However, you must remember to refresh for the most up-to-date information.