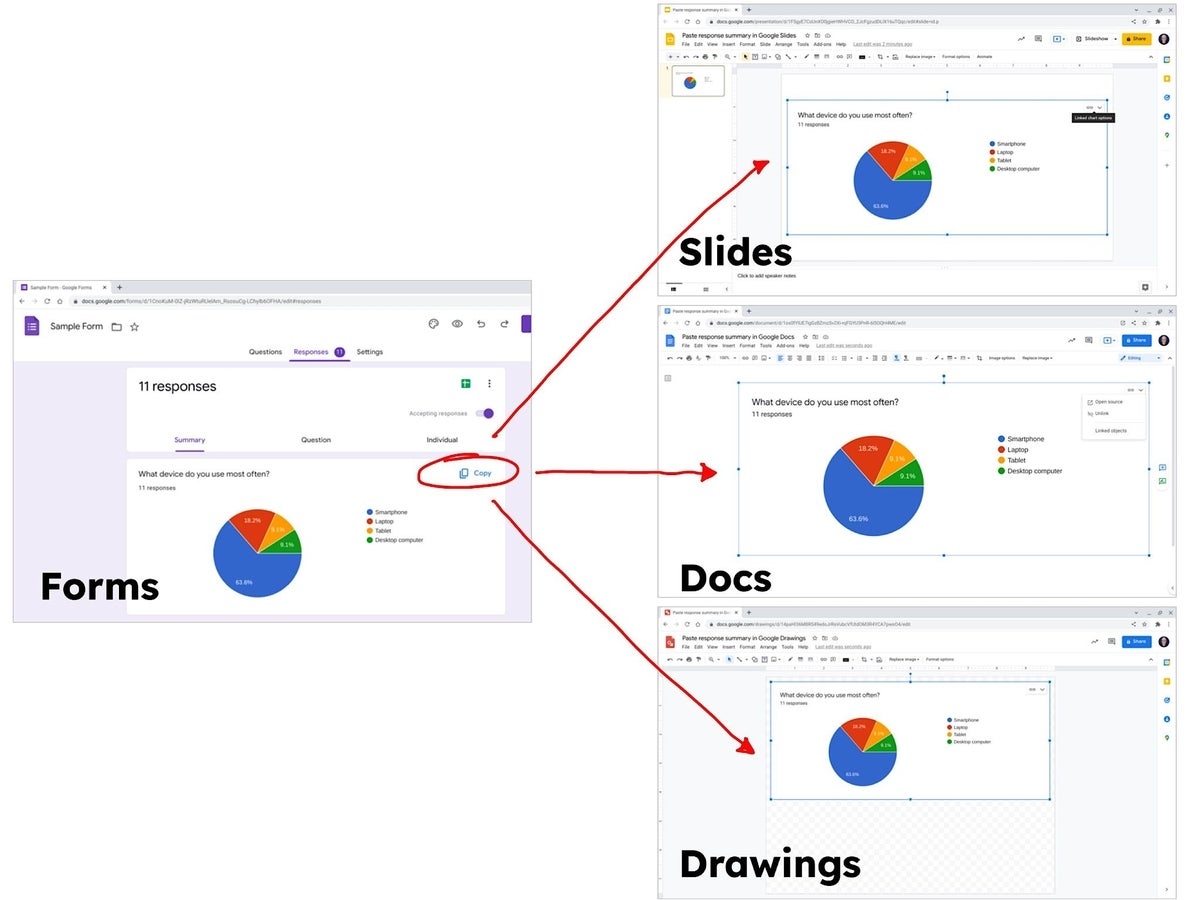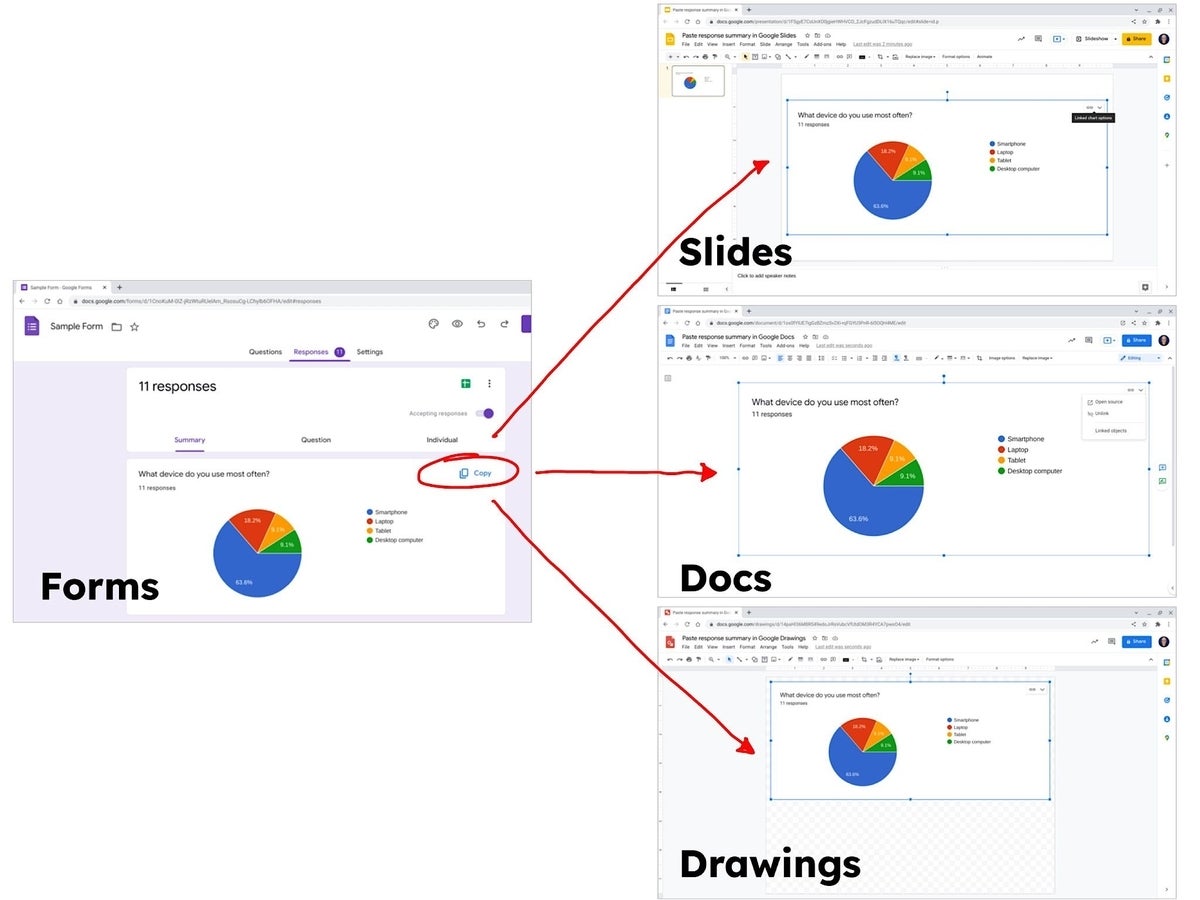
Google added the ability to embed Google Forms summary response charts in March 2022. Specifically, you can copy a response summary chart to the clipboard from a Google Form, paste it into a Google Slide, Doc or Drawing, then choose whether the chart will be linked to Form responses or added as an unlinked image.
This ability to share Form responses with a linked chart in a Slide, Doc or Drawing makes it easier to keep content current. No need to copy and paste a chart repeatedly anymore. Instead, insert the linked chart results and anyone with edit access can select Update to display the latest data.
Embedded Google Forms serve a variety of purposes. You might embed a Form chart in a Drawing, then add arrows or other annotations around the data or add text in a Google Doc to discuss Form feedback. Most notably, though, in Google Slides, you might provide a link to a Form for audience members to follow. Give them a moment to respond, then update and display the linked response results chart(s).
For all of the following steps, make sure to use Google Chrome on a laptop or desktop system.
SEE: The future of work: Tools and strategies for the digital workplace (free PDF) (TechRepublic)
How to copy and paste a Google Form chart into Google Slides, Docs or Drawings
1. Open your Google Form
In Chrome on a laptop or desktop computer, go to Google Forms and open a Form. You will need to select a Form that has at least one response: Otherwise, the Summary charts do not display. (In some cases, you might consider entering a single placeholder response, in order to get the Summary charts to appear.)
2. Select the Summary chart
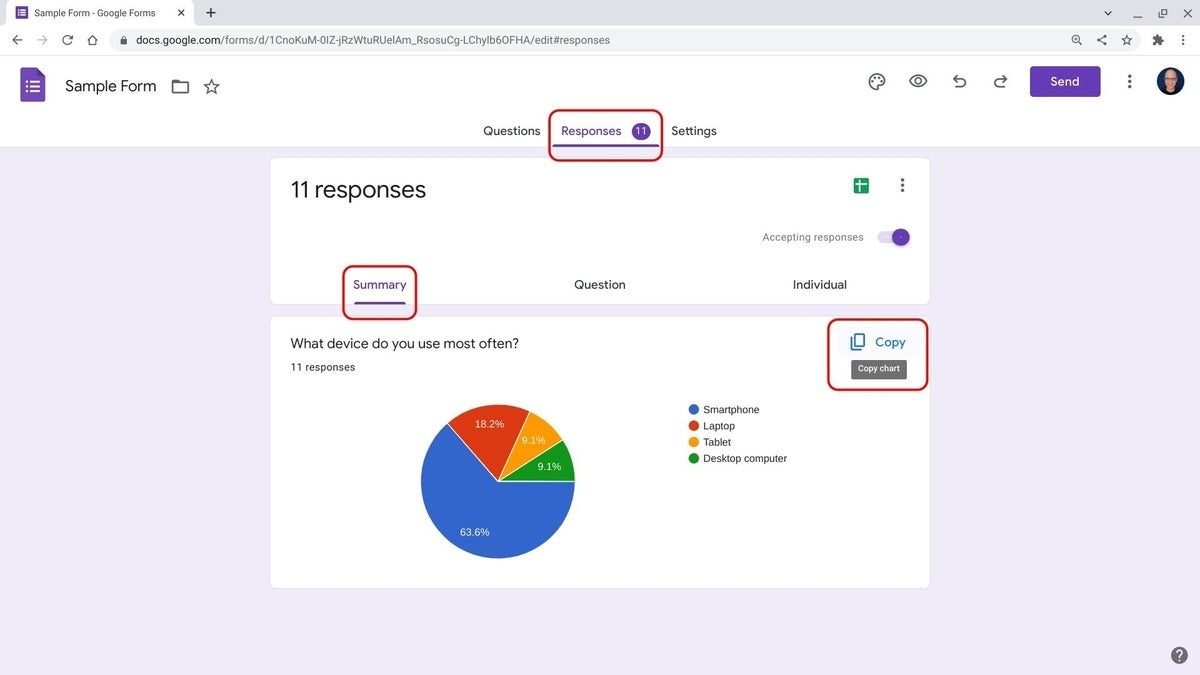
Navigate to Response (tab) | Summary (tab) to display the charts that summarize the responses to Form questions. Click on or tap the Copy button (Figure A) in the upper-right area of the Google Forms summary chart you want to embed elsewhere.
Figure A
3. Open your target Google Slides, Docs or Drawings file
Open a browser tab or window to your chosen target Google Slides, Docs or Drawings file. In Slides, navigate to your target slide. In Docs, place your cursor at your intended insert point. (No additional positioning is needed in Drawings.) Once positioned, select Edit | Paste.
4. Choose Paste method
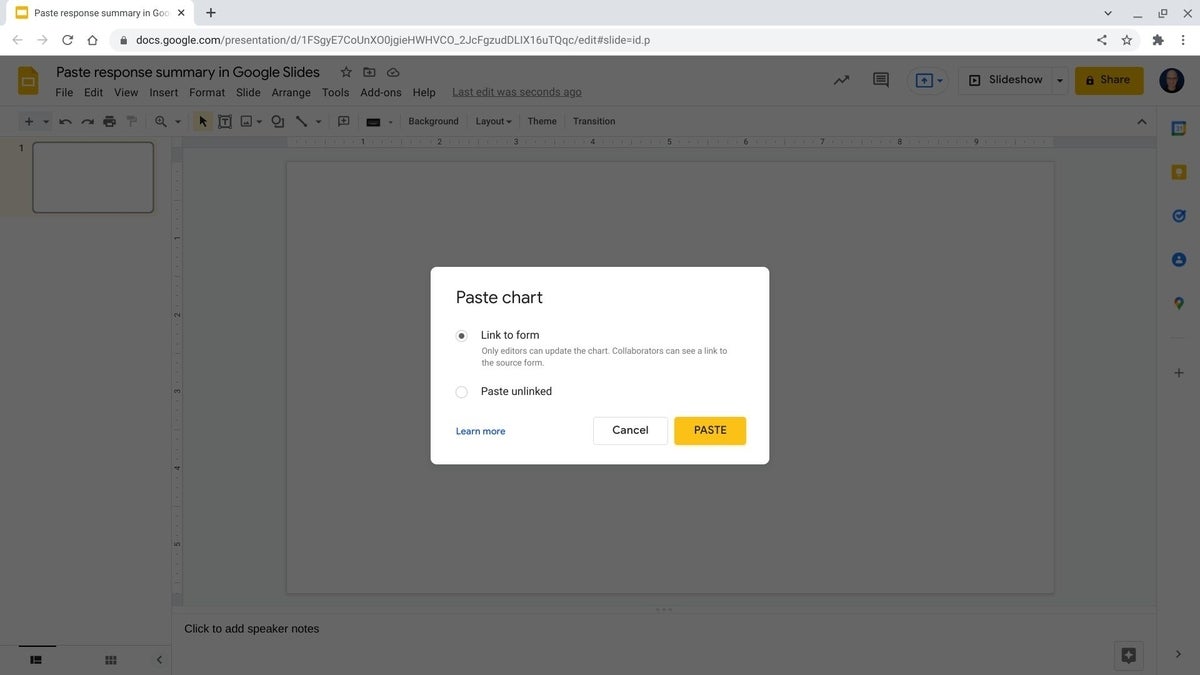
Select Link To Form (Figure B) to add the summary chart and maintain the connection to your source Form data. Otherwise, if you simply want to insert the summary chart as an image that will never change or update, choose Paste Unlinked. Select Paste to insert the chart.
Figure B
5. Adjust chart (optional)
You also can adjust the scale and position of the chart in your document. This sort of size or positioning adjustment has no impact on the chart content, but may potentially make the chart easier to read (e.g., if larger with borders extended to the edge of a slide) or more visually appealing (e.g., if centered on a slide).
SEE: Microsoft vs Google: Forms apps for surveys, polls, and quizzes (TechRepublic)
How to update linked Form charts in Google Slides, Docs and Drawings
People who have the permission to edit a Slides, Docs or Drawings file may choose to update any or all linked objects to display current data. When additional or changed responses to the linked Form occur, an Update indicator displays in the upper-right area of the embedded Form, as well as in the Linked Objects side panel, as shown in Figure C. To update a specific linked chart, select Update from the upper-right area on your chosen embedded chart. To update all linked objects, select the Tools | Linked Objects menu option (in Docs, Drawings or Slides) to display a side panel to the right of all linked items in your file, then select the Update All button at the bottom of the panel.
Figure C
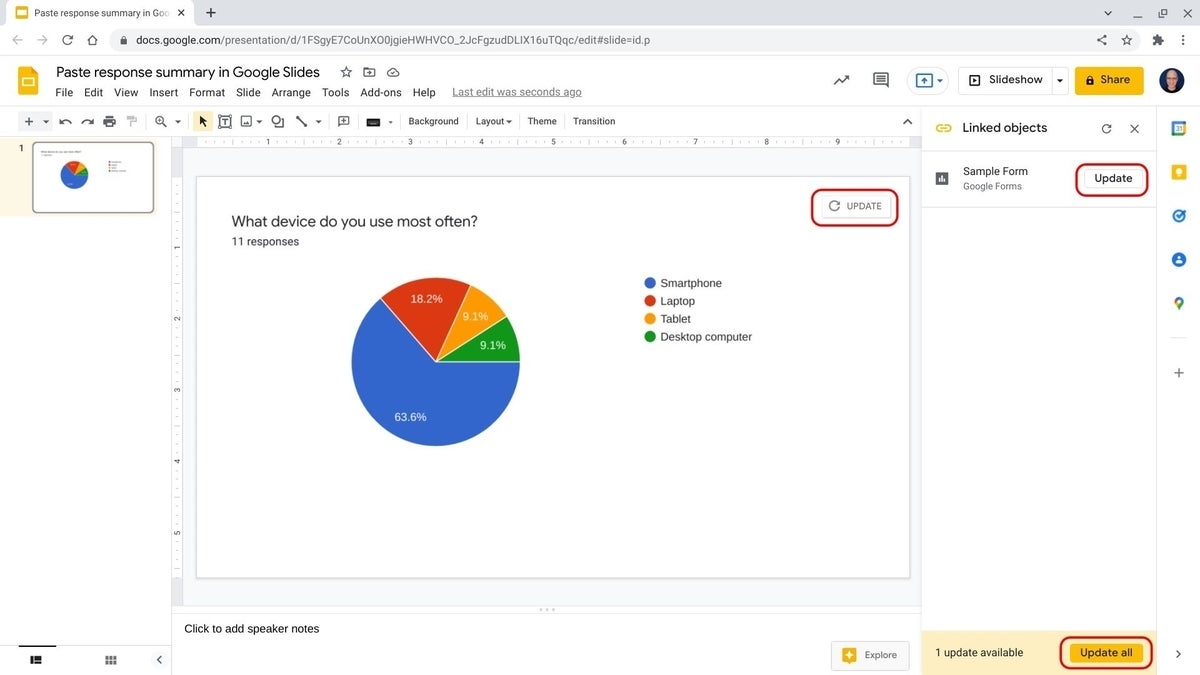
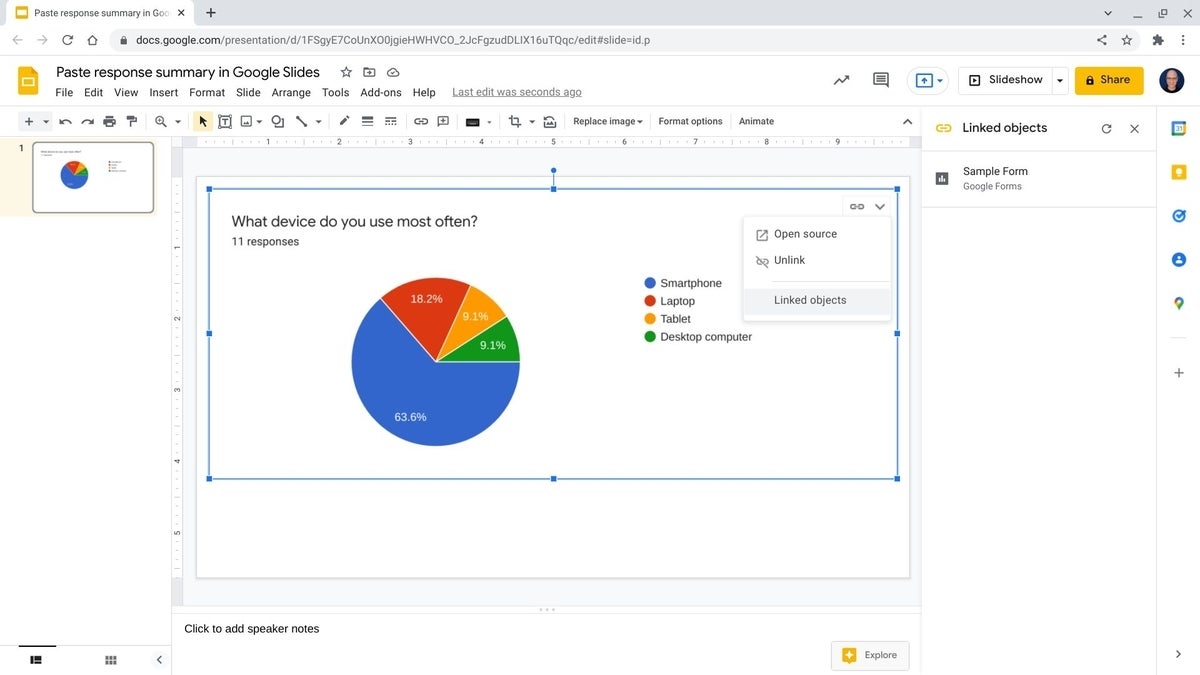
Additionally, you can click on an embedded Form chart to select it and display the Linked Chart Options menu (upper-right corner area, as shown in Figure D). From this menu you can choose from three options:
- Open Source, which opens the linked Google Forms Responses tab
- Unlink, which removes the connection to the Forms Responses chart and turns the chart into a static image
- Linked Objects, which opens the Linked Objects side panel
Figure D
Embedded Form tip
Before you can embed a Google Forms response chart, your Form needs to have received at least one response. In some cases, you may want to provide an initial response, which then allows you to copy a summary response chart to embed in Slides, Docs or Drawings. Then, after your Form receives additional responses, you might delete your initial response so that the chart accurately reflects responses. (If you delete your initial response and there are no other responses, your embedded chart will lose the connection to your Form. As of March 2022, embedded charts require at least one Form response for the summary chart to exist.)
How do you use embedded Google Form charts?
Do you often share Google Forms results in Google Google Slides, Docs or Drawings? What types of discussions do you typically have about Forms results? Does the embedded chart update capability change how you receive feedback during a presentation? In what other settings do you seek and share Forms responses? Let me know how you use charts from Google Forms, either with a comment below or on Twitter (@awolber).
