


If you make use of Linux in your data center, then you have good reason to be on the lookout for a simple-to-use monitoring tool that can give you a quick rundown of what’s going on with your server. Within the realm of Linux, tools like this are plentiful. So where do you start in your quest to find that perfect tool? For me, day-to-day monitoring of Linux servers begins with Nigel’s Monitor, aka nmon.
More about data centers
- Stargate Norway: OpenAI’s First AI Data Center in Europe
- AI Data Centers’ Soaring Energy Use: Who Pays for Higher Utilities Costs?
- China’s Submerged AI Data Center Could ‘Influence Global Sustainable Computing’
- Google to Power Data Centers With Nuclear Energy by 2030 in First-Of-A-Kind’ Agreement
The nmon tool will, using a simple ncurses interface, display the usage for CPU, memory, network, disks, file system, NFS, top processes, resources, and power micro-partition. What’s best is that you get to choose what nmon displays. And since it’s text-based, you can secure shell into your servers and get a quick glimpse from anywhere (as long as “anywhere” has access to said server).
Let’s install nmon and see how it is used.
Installation
The nmon application can be installed from your distribution’s standard repository. This means you should be able to install nmon without too much fuss. For a distribution that uses apt (Debian, Ubuntu, etc.), do the following:
- Open up your terminal window
- Issue the command sudo apt-get update
- Install the software with the command sudo apt-get install nmon
- Allow the installation to complete
If you’re using a distribution that uses dnf (Redhat, Fedora, CentOS, etc.), the following steps will install nmon:
- Open up your terminal window
- Issue the command dnf install epel-release
- Install nmon with the command dnf install nmon
- Allow the installation to complete
You are now ready to make use of nmon.
Usage
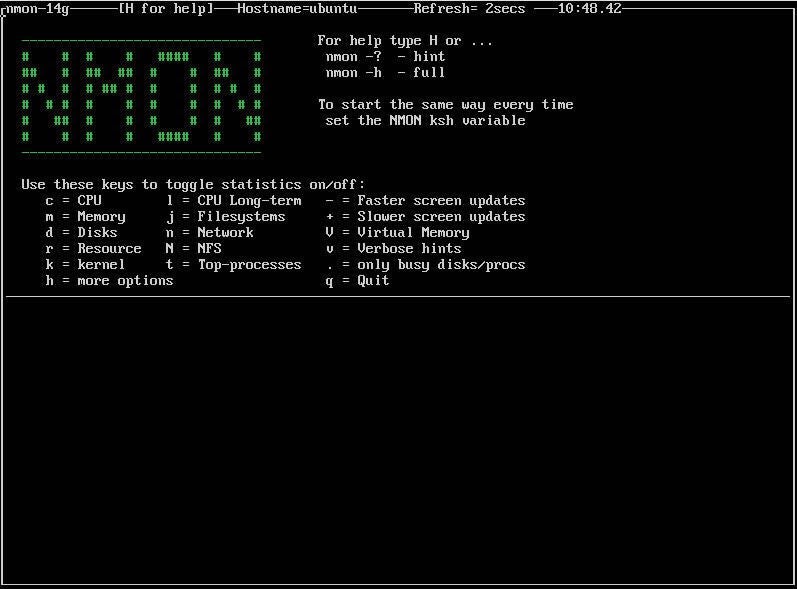
Now that nmon is installed, you can fire it up by issuing the command nmon. In the nmon window (Figure A), you simply have to toggle the statistic(s) you want to view.
Figure A
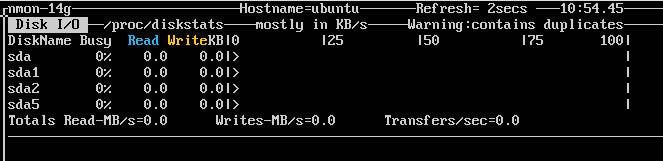
Say you want to view information about disks. If you hit the d key on your keyboard, nmon will display real-time statistics about any and all attached disks (Figure B).
Figure B
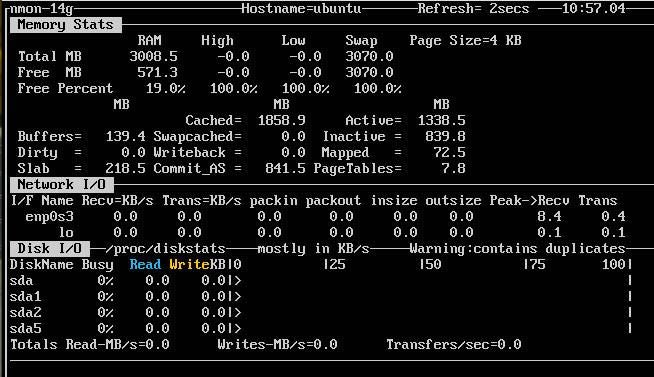
Next we’ll add network and memory to the mix by hitting the n key followed by the m key (on your keyboard). The resulting window will add those real-time statistics to the mix (Figure C).
Figure C
You can toggle any of the added statistics off by hitting the associated keyboard key (the same used to add). The tool also includes the ability to increase and decrease the speed of updates. By hitting the – key on your keyboard you will speed up the screen updates and, conversely, the + key will slow them down.
To quit nmon, hit the q key and you will be returned to your bash prompt.
The tool also includes the ability to capture information and save it to a file. This can come in very handy if you need to monitor a system for a set period of time and then review the collected data later. Say you want to collect thirty rounds of information every 60 seconds. To do this, you would issue the command:
nmon -f -s 60 -c 30
After issuing the above command you will find a file in the current working directory with the extension .nmon. Open that file to view the collected data.
Scheduling data collection
You could even create a cron job to schedule a regular dump of nmon-collected data (which could be handy for troubleshooting an recurring issue). A simple solution for this would be to create a bash script (we’ll call it nmon.sh) that contained something like the following:
#! /bin/sh
ânmon -f -s 60 -c 30
Save that file and give it executable permissions with the command chmod u+x nmon.sh. Now open crontab for editing with the command crontab -e and enter something like this:
30 11 * * * ~/nmon.sh
Save and close crontab. The above cron job will run every day at 11:30 AM. Modify that to fit your needs and you have an easy solution for troubleshooting an issue occurring on your Linux data center machines.
Seriously useful, seriously simple
You’d be hard-pressed to find a simpler solution to a pressing need. With the help of nmon you can monitor your Linux systems in real time or collect data to be combed through at a later date. This tool should be considered a must-have for any Linux sysadmin.