


Most systems administrators rely on tools that provide insight into the goings on of the systems they manage. From monitoring app deployments to being able to see the who, what, where, and when that occurs on their devices–every bit of information gleaned plays an important role in management going forward.
Must-read Windows coverage
- CrowdStrike Outage Disrupts Microsoft Systems Worldwide
- 10 Best Project Management Software for Windows in 2024
- Windows 10 Extended Security Updates Promised for Small Businesses and Home Users
- Securing Windows Policy
Experienced sysadmins or those responsible for sites with smaller footprints may have any easier time determining the normal operation of a particular device. However, free tools are built into the Windows Server Manager app in every version of Windows client since Windows 8.1 and every server OS since 2012 that allow us to measure the initial and ongoing resource utilization of Windows-based systems all the way up to the latest versions: Windows 10 and Server 2016.
Obtaining baselines is an extremely useful strategy for a variety of reasons. Chief among them is the ability to obtain day-to-day knowledge of the impact on resources of a system, detecting security issues via possible indicators of compromise, and acting on this information if anomalies are detected so you can prevent them from becoming larger issues in the future.
Note: Before you can begin configuring the performance indicators in Windows Server Manager on Windows client OSes, you must first install the Remote Server Administration Tools (RSAT), which enables the use of the application and installs the necessary dependencies. Windows Server OSes have this feature enabled by default.
SEE: Windows 10: Streamline your work with these power tips (free TechRepublic PDF)
Adding a device to Server Manager
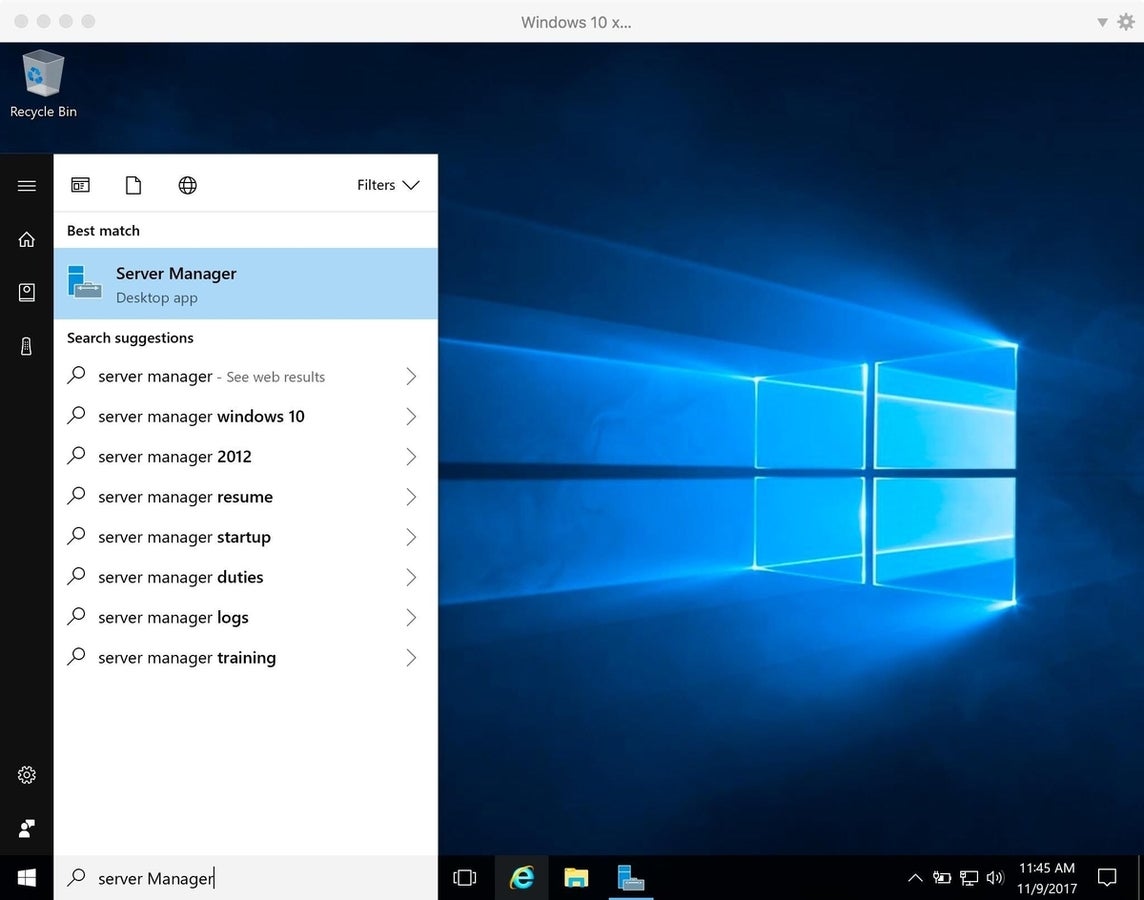
To get started, launch Server Manager by searching for it in the Start Menu (Figure A) or navigating to the following path:
%windir%system32\ServerManager.exe
Figure A
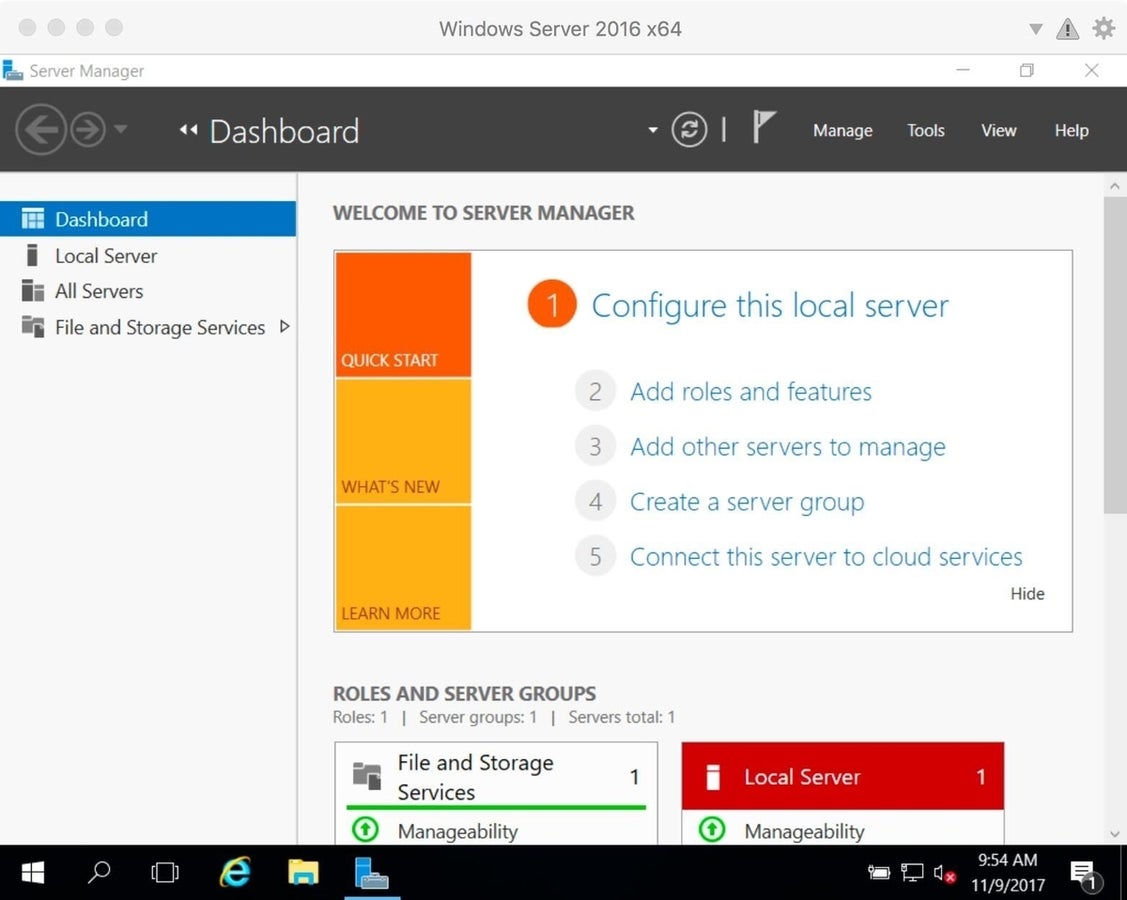
When Server Manager loads, the Dashboard is the default view. It provides an overview of the devices that are currently being managed, along with their health status. By default, server OSes automatically add the local server to the list. However, no devices are added on client OSes, so you must add them manually if you want to manage them (Figure B).
Figure B
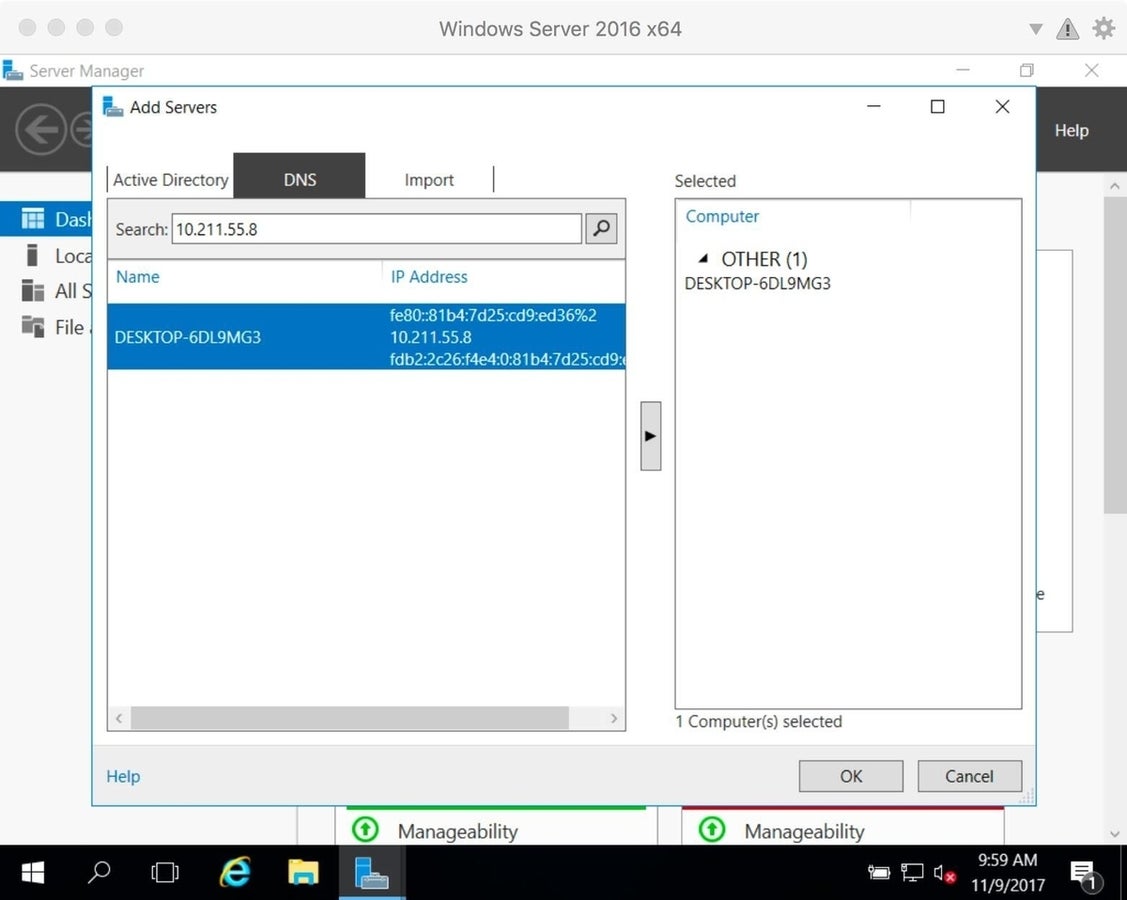
Click on Add Other Servers to manage link to begin setup. You can add computers based on Active Directory membership (if they are part of a domain) or DNS (or IP address). You can also import a list of devices. In this case, I’m adding one by IP, by searching for the address first and then clicking the arrow to add it to my list and clicking OK to confirm (Figure C).
Figure C
Once devices are added, they will be manageable from the Server Manager console, including adding/removing roles, monitoring events and services, and of course, via performance indicators and Best Practice Analyzer.
Set Best Practices Analyzer
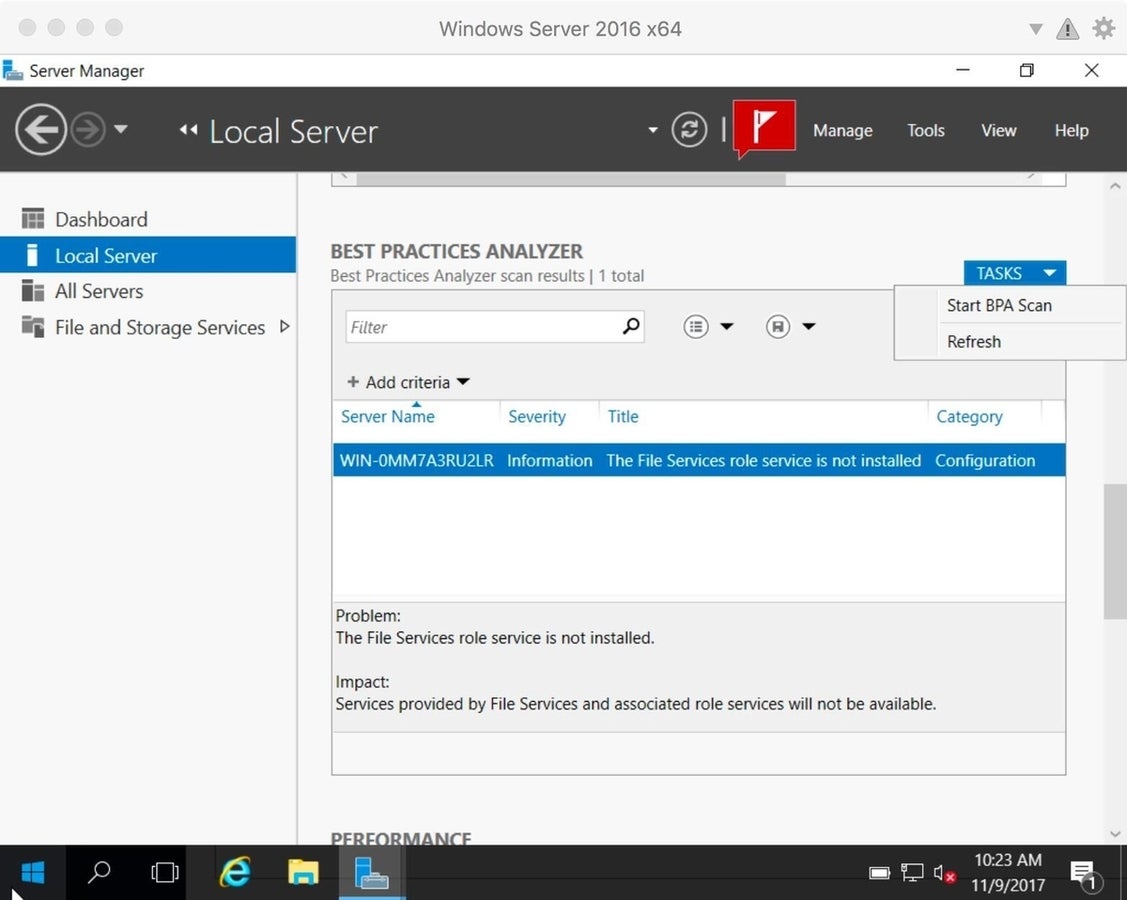
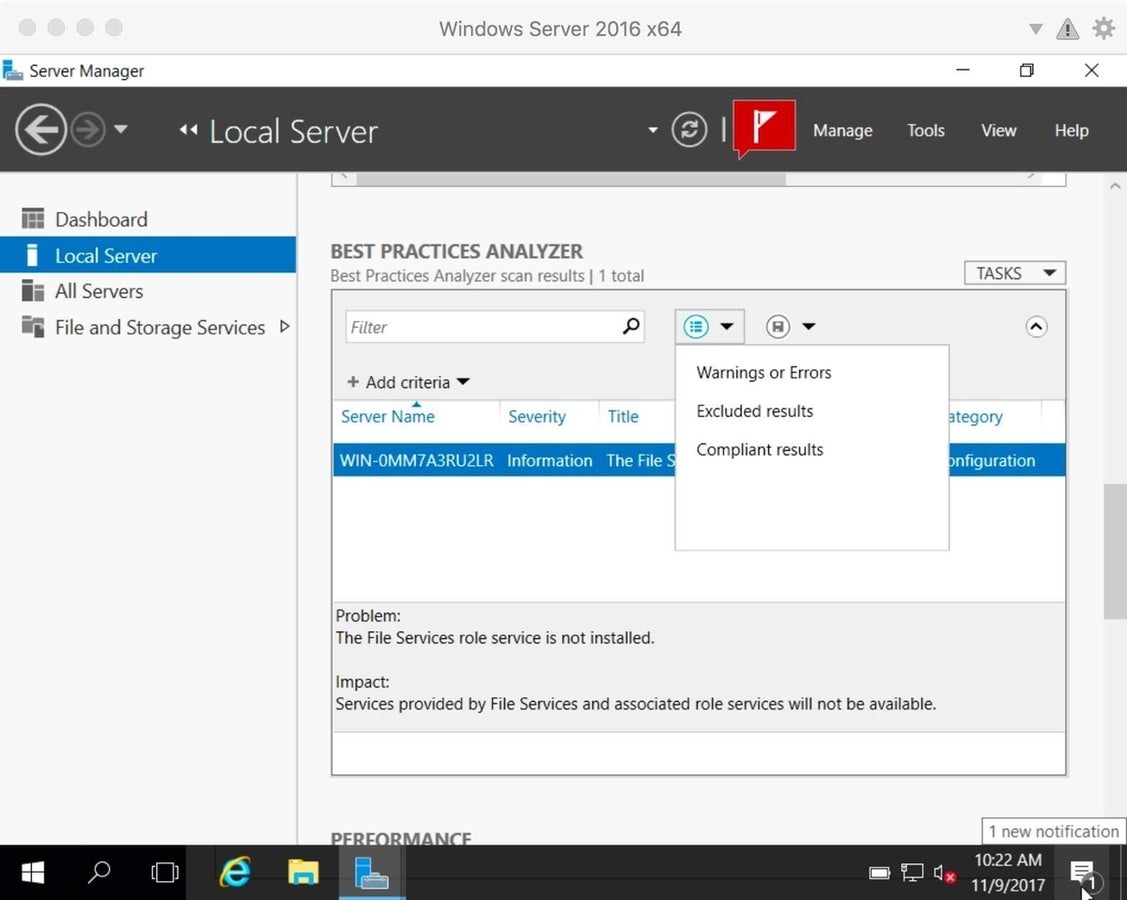
Click on the server you want to manage, scroll down to the Best Practices Analyzer section, and click on Tasks | Start BPA Scan. This will initiate the scan and provide an analysis of the system’s roles and services. It will search for any issues that are found based on the configuration of the system and then report back any findings that may indicate issues affecting the performance and/or security of the devices (Figure D).
Figure D
In addition, you can configure the search queries by adding criteria and modifying search terms to target specific points of interest you want to assess better. You can also save search queries for future use across multiple devices by clicking the Save button. To restore those saved queries, click the Unsorted Items button next to Save to display a list of previously saved queries (Figure E).
Figure E
Set performance counters
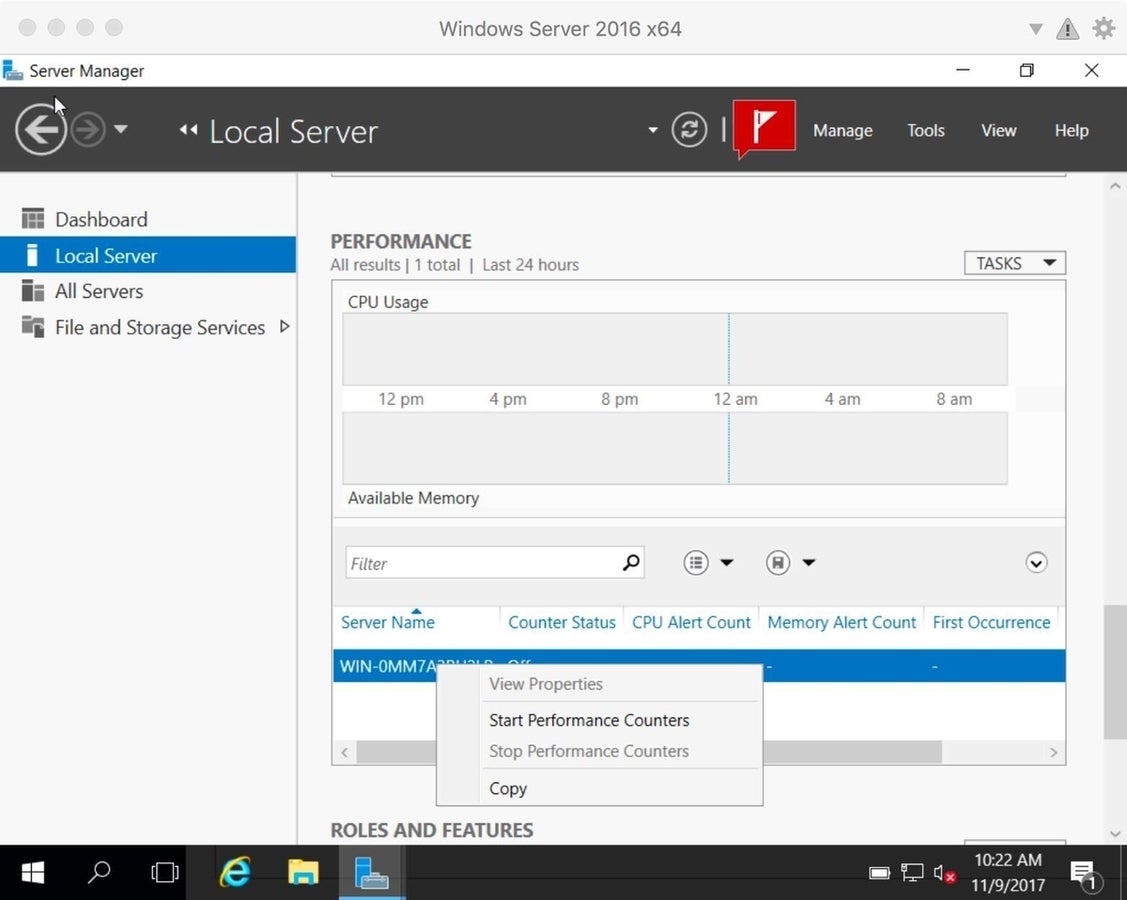
Under the Performance section, you should see the server name in the list. There are a series of performance indicators in the columns under Counter Status that should be set to Off. This is the default behavior, as they must be manually started to be initiated. Right-click the hostname of the server you want to enable and select Start Performance Counters from the context menu (Figure F).
Figure F
Scans will vary by system, as they depend on the hardware specifications and on-going tasks being performed by the server to process data. However, once the first scan has been completed, the baseline will be stored on the device and can be used as a reference point for administrators to act on should its status change.
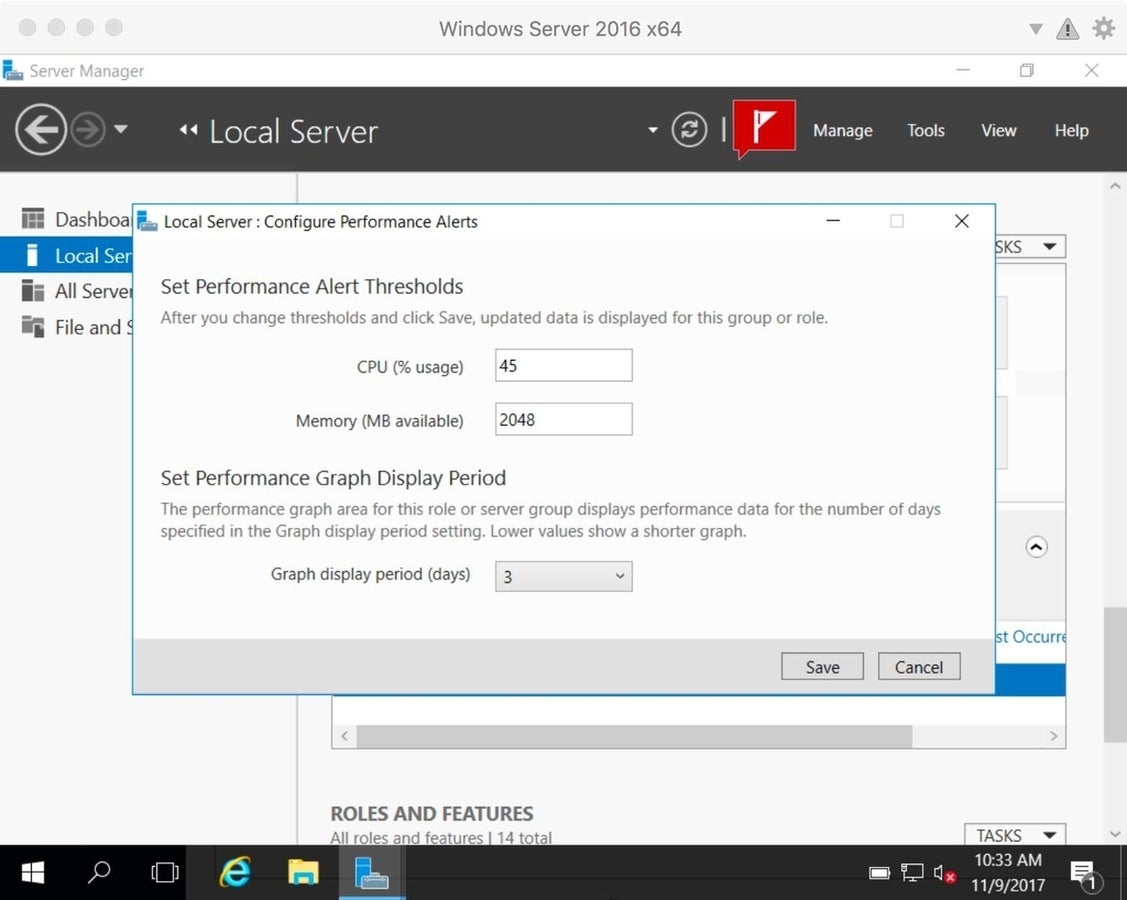
To assist in detecting status changes, admins can configure performance alerts for each system being managed, which allows them to specify thresholds for CPU and memory utilization. These indicators will trigger an alert should the system exceed the bar the admins set, providing them with concrete data to show how much of a resource was used, the timestamp of when it occurred, and what caused the spike. To configure performance alerts, click on Tasks | Configure Performance Alerts from the dropdown menu (Figure G and Figure H).
Figure G
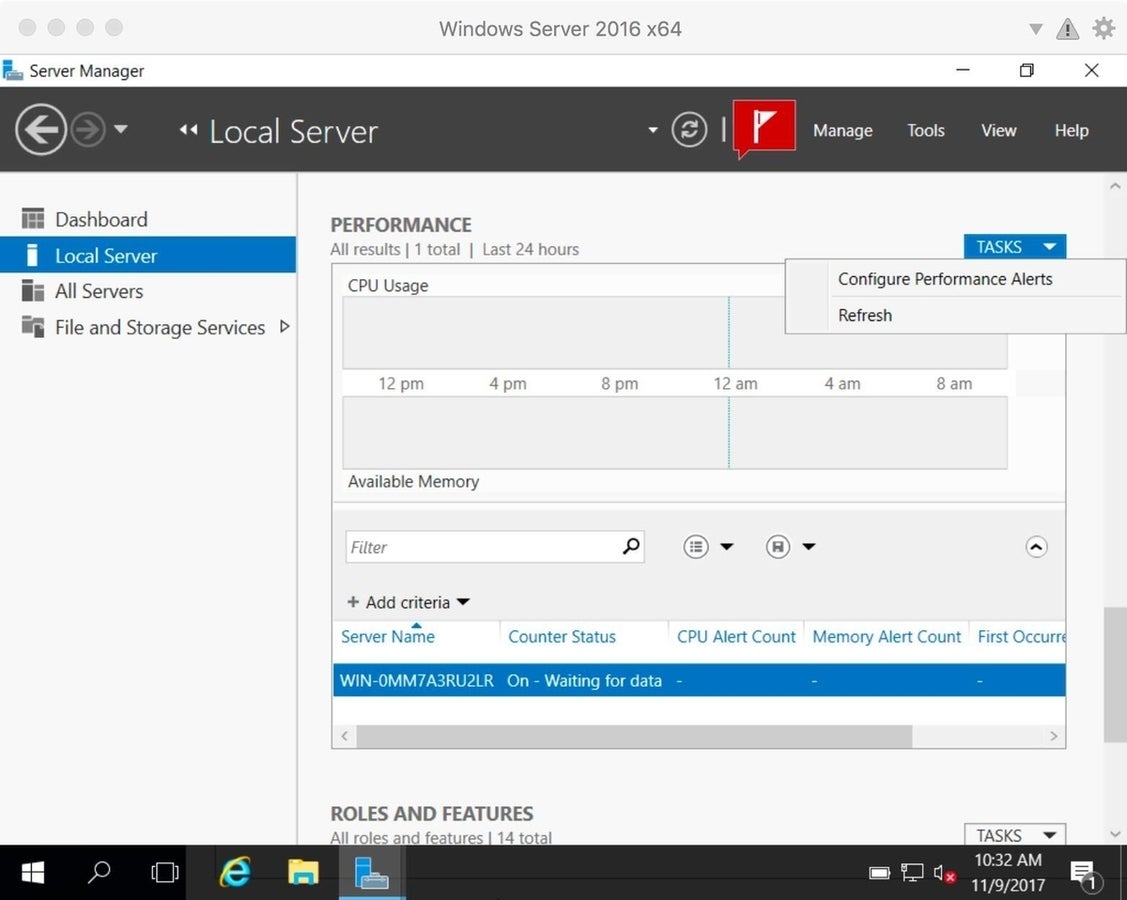
Figure H
Here are some general points concerning performance baselines you should adhere to as part of a best practices initiative:
- Different systems require different configurations and rely on resources in varying ways due to the roles of the services being provided. Test systems individually using benchmarks based on the unique requirements of the service–not the system in general–for optimal performance.
- Measurements should be taken at regular intervals over time or per schedules. This helps admins to establish a working knowledge of the server’s performance and to detect trends that occur over time.
- Multiple measurements should exist per system. Take measurements during peak usage times, as well as off-peak times. Also take them during maintenance windows and backup/restoration periods to determine the average utilization across various system states.
- New baselines should be generated for each phase when hardware upgrades have been performed or major updates to operating system software have occurred, to provide the information commensurate with the increased performance.
- Lastly, remember that baselines are mainly used to provide guidelines for admins to follow based on average performance and usage statistics of a system. Comparing current performance results to established baselines helps identify areas that may need to be reconfigured, modified, and/or patched, especially if performance indicators are lower than what the hardware is capable of producing.
Also read…
- Professional Guide to Windows Server 2016 (TechRepublic Academy)
- Microsoft’s new open source tool can scan your website for security and performance headaches (ZDNet)
- Windows Server 2016: The smart person’s guide (TechRepublic)
- Microsoft’s Windows Server 1709: What’s missing (ZDNet)
Other advice?
Do you have any tips for performing baselines on your systems? What suggestions can you provide regarding software-based benchmarking configurations? Share your tips with fellow TechRepublic members.