Susan Sales Harkins is an IT consultant, specializing in desktop solutions. Previously, she was editor in chief for The Cobb Group, the world's largest publisher of technical journals.
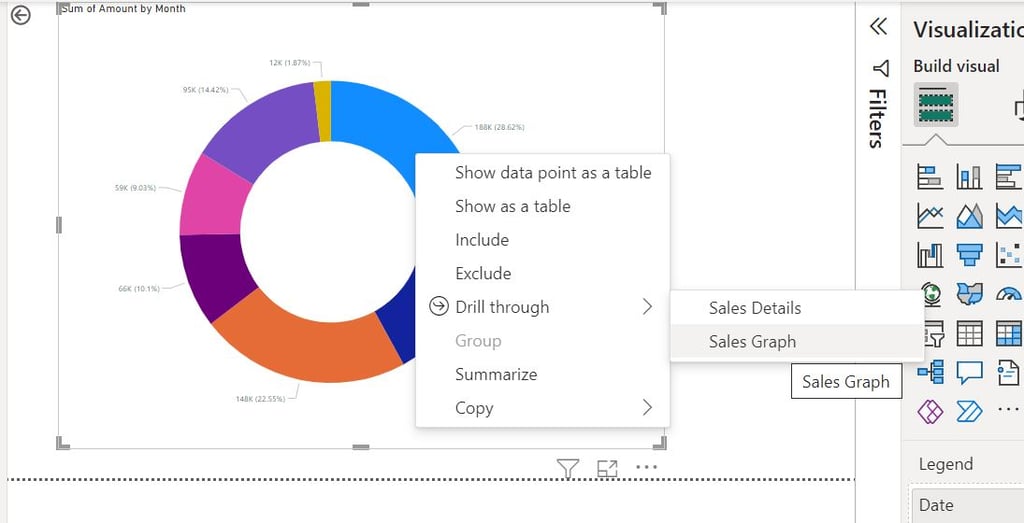
Adding drill through functions to Power BI data visuals lets users group data visuals on the main page alongside the details. Here’s how you can add drill through visuals in your Power BI reports.