


Mobile devices are great for a quick document or project check-in when employees are away from their PCs. When it comes to Microsoft Power BI, end users often need access to dashboards from outside the office — whether that’s in a meeting, at lunch with a coworker, visiting a client site or catching up on work at home.
Fortunately, Power BI designers can design and optimize dashboards for mobile devices, saving end users a lot of frustration by giving them up-to-date access to information wherever they are.
SEE: Hiring kit: Microsoft Power BI developer (TechRepublic Premium)
In this tutorial, I’ll show you how to use the mobile layout feature to design a Power BI dashboard for mobile devices. The design works with all mobile sizes and shapes that rely on iOS, Windows and Android mobile operating systems.
For this demonstration, I’m using Microsoft Power BI desktop on a Windows 10 64-bit system, but you can also use Power BI service. If you’re interested in following along during this tutorial, you can download the demonstration .pbix file, Adventure Works Sales, from GitHub. Once downloaded, double-click the .pbix file to open it in Power BI; alternatively, you can use a .pbix file of your own.
Jump to:
- How to prepare the dashboard in Power BI
- How to use mobile layout view to publish to a mobile device
- How to view a Power BI dashboard on a mobile device
How to prepare the dashboard in Power BI
Thanks to Power BI’s built-in features, configuring a dashboard for mobile devices is fairly straightforward. Before we get to that, however, we need visuals. Let’s create a quick report.
Figure A shows a simple set of reports that you can quickly create. To create the column chart, do the following:
- Click Clustered Column Chart in the Visualizations pane.
- In the Fields pane, expand the Products table and check the Category field.
- Expand the Sales table and check the Sales Amount and Total Product Cost fields.
Figure A
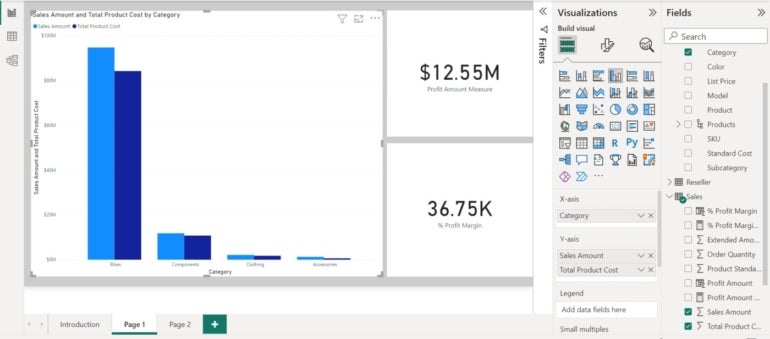
To create the profit card, do the following:
- Click the Card visual in the Visualizations pane.
- In the Fields pane, check Profit Amount Measure in the Sales table. If you’re not working with the downloadable demonstration file, you can leave the card blank.
Must-read Windows coverage
- CrowdStrike Outage Disrupts Microsoft Systems Worldwide
- 10 Best Project Management Software for Windows in 2024
- Windows 10 Extended Security Updates Promised for Small Businesses and Home Users
- Securing Windows Policy
Create a second card and check % Profit Amount measure in the Sales table or leave it blank. The content isn’t that important. Configuring it all to fit on a mobile device is our focus.
For a quick comparison, let’s publish the report as you normally would with these steps:
- Click the File menu.
- Choose Publish from the left pane and then Publish to Power BI in the right pane.
- Save changes if prompted.
- Choose a destination, such as My Workspace, and click OK. Make sure this is a public site within your organization or one that end users can access.
- Click the resulting link to see the published report shown in Figure B.
Figure B
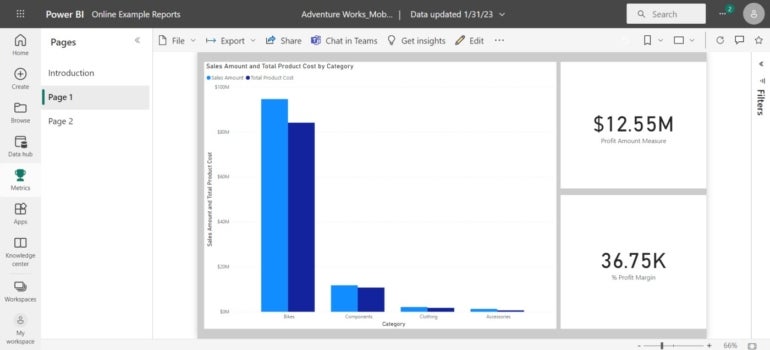
As a Power BI designer, there are formats you might want to apply to make all three visuals look better, but for our purposes, this isn’t necessary. Now that you’ve seen the published report, let’s reconfigure it to display on a mobile device.
How to use mobile layout view to publish to a mobile device
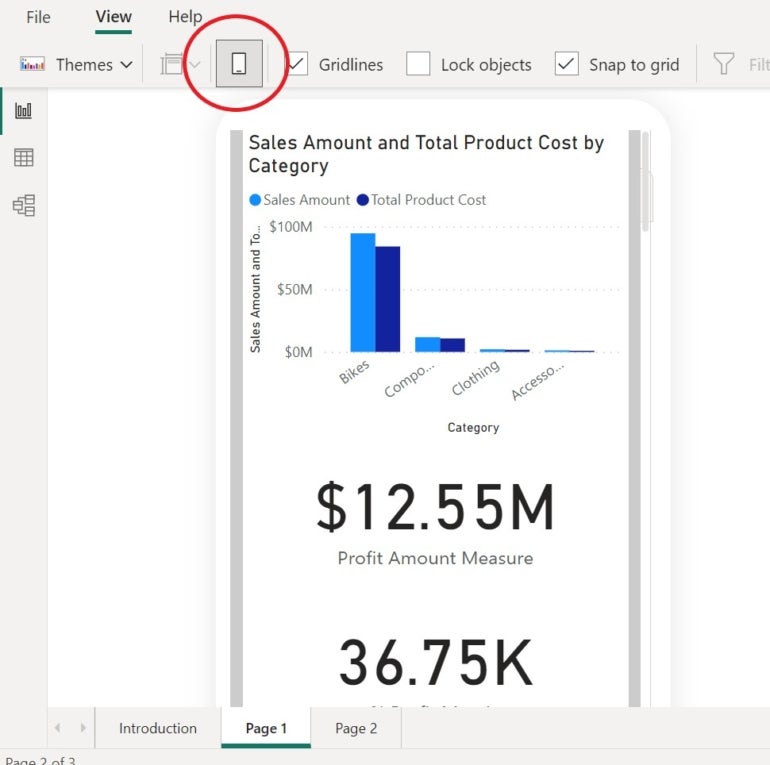
The good news is that Power BI does all the work for you when designing reports and dashboards for mobile. To illustrate, let’s return to Power BI. Web view is the default, so take the following steps to add a mobile layout:
- Click the View menu.
- Click Mobile Layout and click Continue for the information Phone Version prompt if displayed.
- Double-click the visuals to the right to add them to the mobile frame.
- Resize and rearrange until you’re satisfied (Figure C).
Figure C
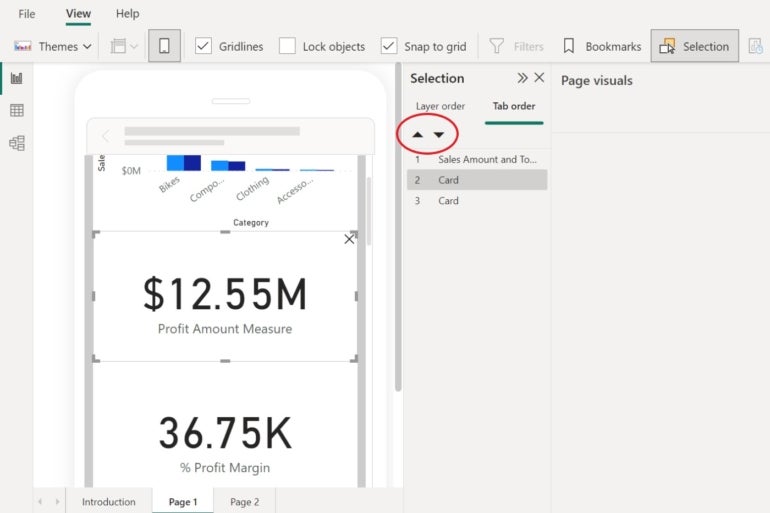
- Click the Selection tab.
- In the right pane, click Tab Order in the Selection pane; they might not be in the order you expect.
- Rearrange the tab order by clicking the up and down arrows (Figure D).
Figure D
At this point, we have a reasonable dashboard for mobiles. If you’re worried about the original web configuration, don’t be concerned — you won’t lose it. The web dashboard will offer two views: web and phone. You can access the phone layout using the web layout from the Edit menu.
SEE: How to build reports in Microsoft Power BI (TechRepublic)
We didn’t do much to our phone view in order to keep things simple, but you can arrange the visuals in any order, resize and so on. If you don’t want all the visuals in mobile view, don’t add them. You have a great deal of flexibility when designing and formatting this optimized view.
We optimized only page one of the report. Make sure to follow this same process with all pages you want to make viewable on mobile.
Now we’re ready to view the dashboard view on a mobile device.
How to view a Power BI dashboard on a mobile device
To see the new mobile view, republish the report using the instructions above. It doesn’t matter what view you’re in when you do so. When asked to replace the existing dashboard, click Replace.
On your mobile device, use your favorite online app store to download and install the Microsoft Power BI app if you don’t already have it. It only takes about a minute, and your store should know to download the right version. If prompted, be sure to denote whether you’re using an Android, iOS or Windows Phone, though that shouldn’t be necessary.
On your mobile device, do the following:
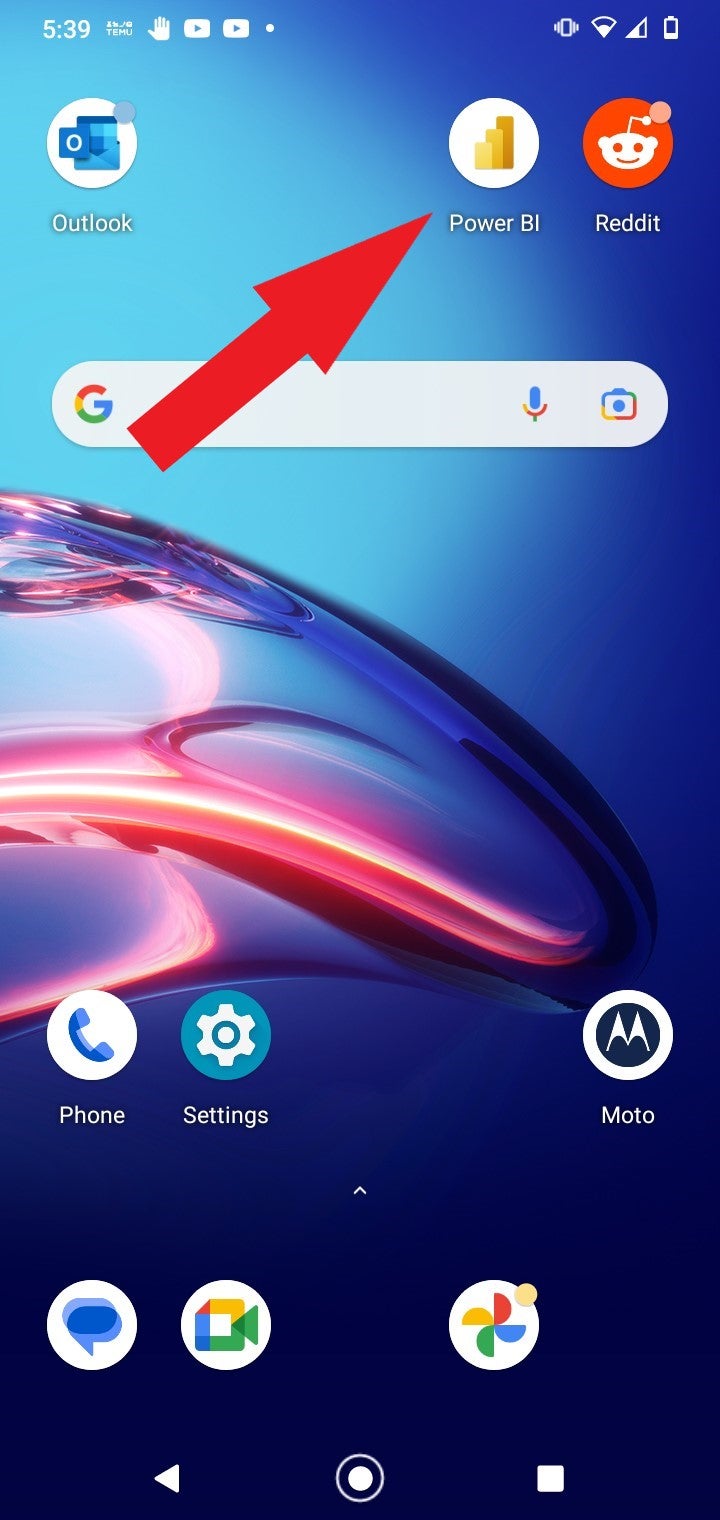
- Open Power BI (Figure E).
Figure E
- Find the report (Figure F) and press on it to open it.
Figure F
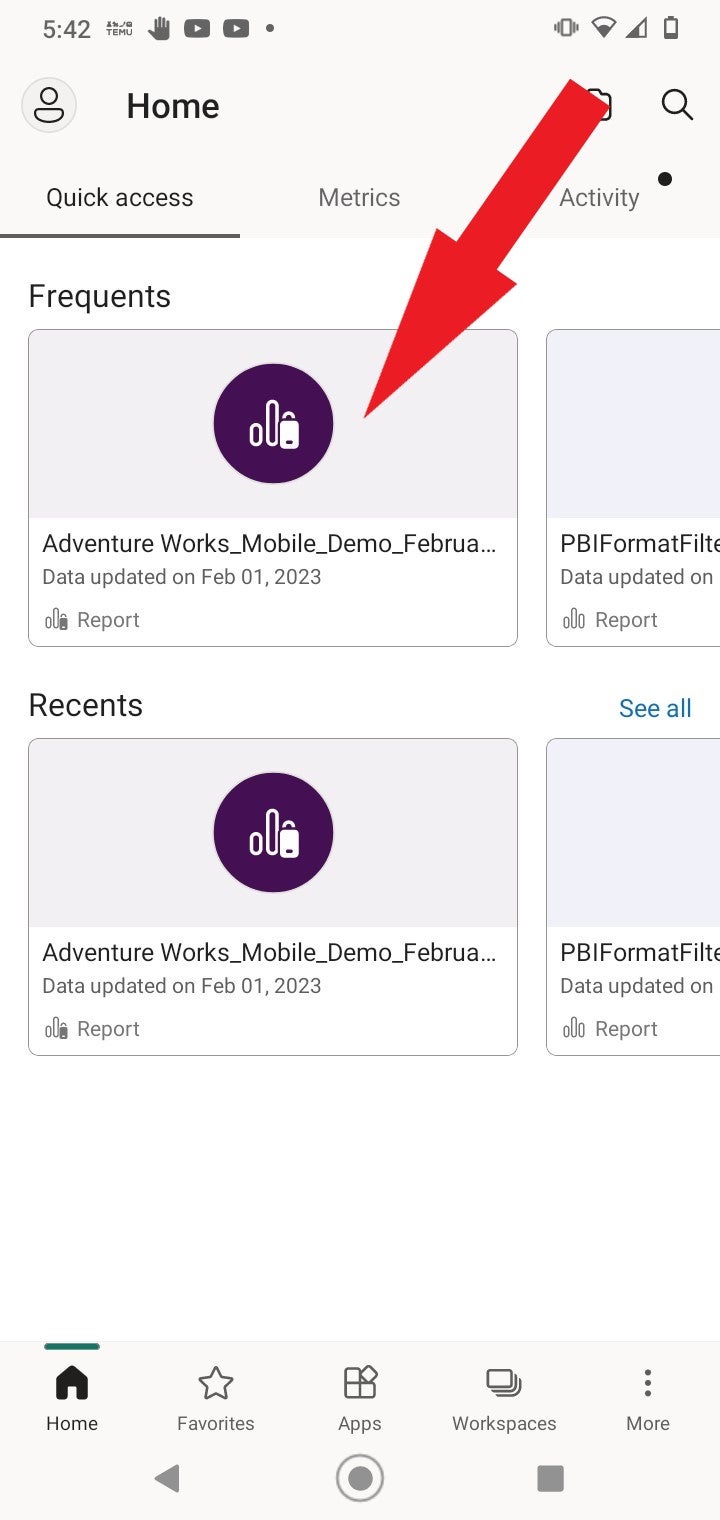
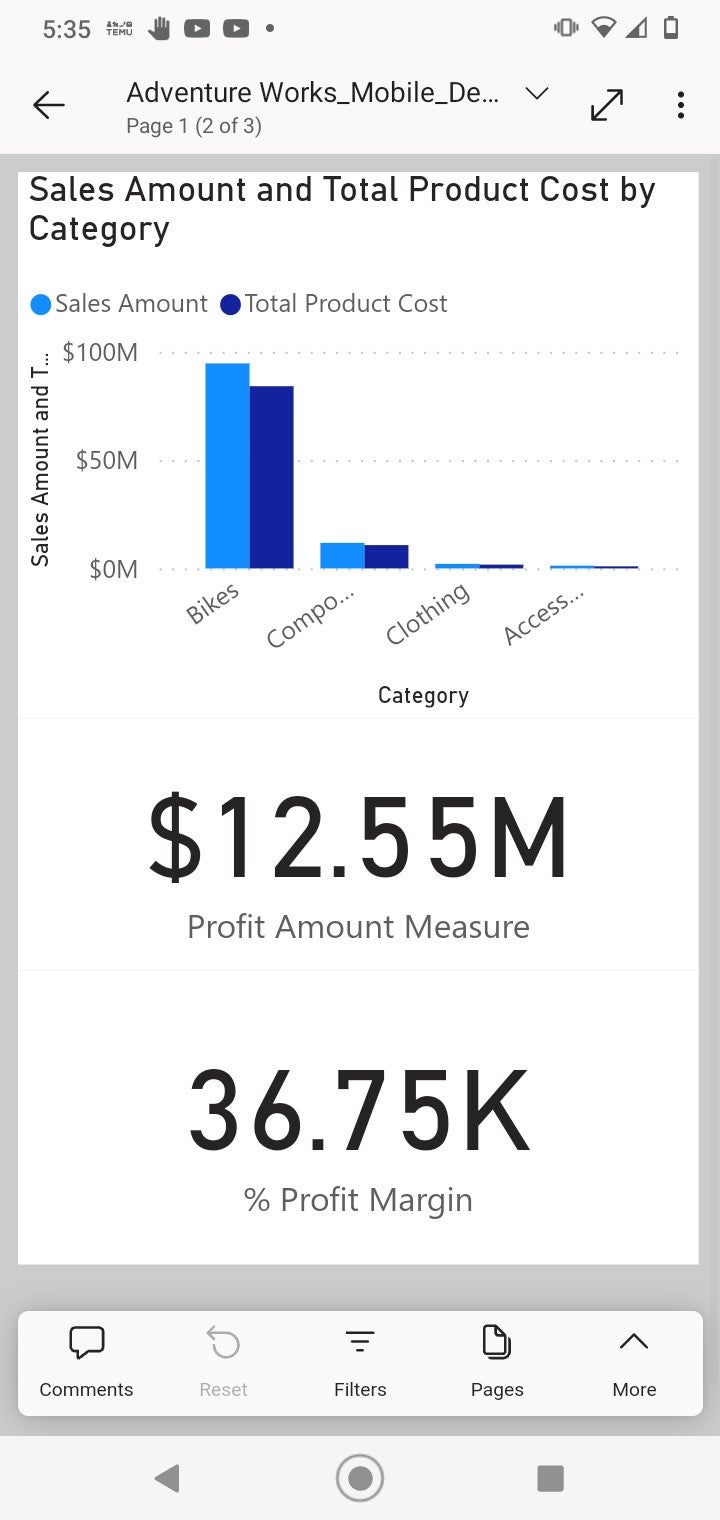
Figure G shows the resulting dashboard on an Android phone. At this point in time, you can interact with the dashboard as you normally would with the web layout.
SEE: Mobile device security policy (TechRepublic Premium)
It isn’t perfect yet, but you still have the option to return to Power BI Desktop or service to make changes. If you choose to go back and make additional changes, be sure to republish to commit those changes to the mobile version dashboards.
Figure G
The link to the published dashboard, in this case, is irrelevant. If you send that to someone, they will open Power BI in designer view, which isn’t what you want. Instead, make sure you share the report to a public workspace or to a workspace that end users are authorized to access. If the report isn’t visible to end viewers, you might have to grant permission to the workspace or the report itself.
Read next: Best business intelligence tools (TechRepublic)