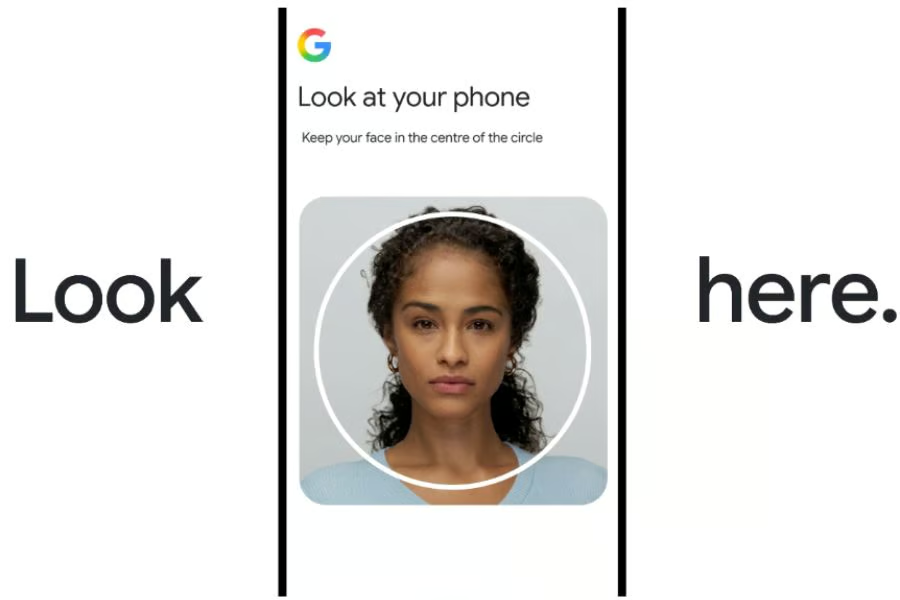
Image: iStock/HATICE GOCMEN

It’s close, but the race continues. Google extended its lead over Facebook at the top of Retention Index’s Universal Power Ranking: from 69 vs. 68 power ranking score in Index 11 (the first half of 2020) to 69 vs. 64 in Index 12 (second half of 2020). On Thursday, AppsFlyer released the 12th edition of its Performance Index, in which it ranked the top media sources in mobile advertising. For the latest edition, AppsFlyer analyzed 580 media networks, 29 billion installs, more than 16,000 apps and 60 billion app opens, from July to December 2020.

Google demonstrated marked growth on Android, and Facebook’s quality across indices has been significant. Google’s share in the global non-organic (ad driven/prompted) app install increased by 15% in Index 12, driven by its Android growth, particularly in developing markets and India. Google’s share in Android remained relatively unchanged in North America and Western Europe, as well in the global iOS rankings.

Facebook dropped 10% in Index 12, which is credited primarily to iOS losses (as part of an overall drop in iOS). But as quality is concerned, Facebook dominates, and is ranked second in the average of quality metrics across all of the indices. Its retention score is 16% higher than Google’s, which AppsFlyer saw as the result of a growing divide in Android and among non-gaming apps. Still, on the gaming iOS front, Google narrowed the quality gap, but Facebook still has the upper hand.

SEE: COVID-19 workplace policy (TechRepublic Premium)

Facebook is still dominating the remarketing (gaining back previous users) index, despite Google’s demonstration of impressive growth. It significantly increased efforts here, growing its share of app remarketing conversions by 65% in the second half of 2020.

The report showed a 20% drop in non-organic iOS installs among the vast majority of media sources. Apple’s ATT framework won’t be enforced until early spring, but it is already causing shifts, according to AppsFlyer’s Performance Index. “The decline was widespread, impacting the rankings of 17 of the top 20 media sources on iOS” AppsFlyer said.

Simultaneously, the share of organic installs in iOS remained unchanged, as did the number of apps running campaigns on the platform. Android’s net operating income share showed the opposite, as it increased by 6% over the same period.

TikTok for Business showed significant growth in iOS gaming and maintained its position in Index 12 in the No. 6 position in global volume ranking, with significant gains in gaming. There was a 37% increase in global gaming apps and an additional 55% rise in the number of gaming apps running on its platform. In non-gaming power rankings, TikTok went up one level to No. 7 in iOS and No. 8 in Android. “On cross-platform category level, it reached a top five power ranking in entertainment, social, lifestyle, health & fitness, finance, photography and utility group,” AppsFlyer reported.

Users who enabled Limited Ad Tracking increased by 40% continuing the increase of previous evaluations which had LAT at 23% to 32%.

Unity Ads is ahead of its gaming competitors ironSource and AppLovin, which are gaining ground on the Google-Facebook “duopoly,” AppsFlyer reported. Unity Ads took the No. 2 position in the Retention Index’s Global Gaming power ranking, ahead of Facebook. AppsFlyer further reported, “On the genre level, Unity Ads hit the number one spot in the power rankings for Hyper Casual, Arcade, Puzzle, and Word.”

Also see