


In last week’s post, Is ReadyBoost still an effective tool in Windows 10?, I pointed out that unless you are running Windows 10 on an SSD, ReadyBoost can help improve disk performance. I described how ReadyBoost works and showed you how to set it up. As I ended my examination, I mentioned that it’s important to realize that the performance gain provided by using ReadyBoost is subjective and will depend on what kind of applications you run on your computer and what type of data you typically work with.
Fortunately, you can monitor ReadyBoost performance in Windows 10 to find out. Let’s take a closer look.
My test system
I recently performed a clean install of 64-bit Windows 10 Pro on an older ASUS F3 with an AMD Turion 64 X2, 80GB hard disk, and 1GB of RAM. This is the system on which I have been experimenting with ReadyBoost. Since it really highlights a use case for ReadyBoost, I’ll use that system for this article.
SEE: How to use Windows 10’s Resource Monitor to track memory usage
Using Resource Monitor
The first way you can investigate ReadyBoost’s performance is with Resource Monitor. To get started with Resource Monitor, press [Windows]+R, type Resmon.exe in the Open text box, and press [Enter].
In the Resource Monitor user interface, select the Disk tab. Now, select System check box in the Processes With Disk Activity panel to enable the Filtering feature, which will allow you to highlight certain processes or services. When you select a process, all other processes are filtered out so that it is easy to see where and how the selected process is coming into play. Each place where that particular process occurs will be highlighted in orange.
Must-read Windows coverage
- CrowdStrike Outage Disrupts Microsoft Systems Worldwide
- 10 Best Project Management Software for Windows in 2024
- Windows 10 Extended Security Updates Promised for Small Businesses and Home Users
- Securing Windows Policy
Next, move down to the Disk Activity panel, where you’ll see that the display is showing only files that are running under System–which will make it easy to locate and select the ReadyBoost.sfcache file on your USB flash drive. In my example, this is D:\ ReadyBoost.sfcache.
At this point, launch an application that will perform a lot of disk activity, reading and writing data to and from the hard disk. In my test, I launched Microsoft Edge, which immediately began reading and writing data.
When you load an application that performs a lot of disk activity, your Resource Monitor window will look similar to the one shown in Figure A.
Figure A
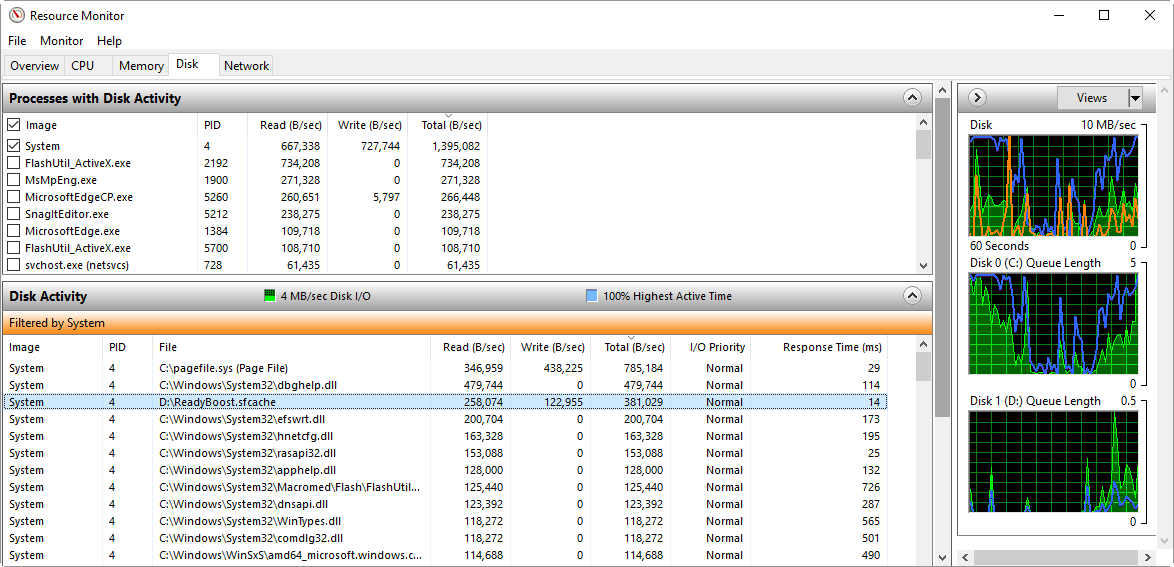
Resource Monitor provides a good view of ReadyBoost in action.
Looking at the Read, Write, and Total columns in the Disk Activity panel, you can see that the ReadyBoost.sfcache file is indicating that ReadyBoost is writing and reading a fairly sizable amount of data to and from its cache. If you continue working with your application, you’ll see a lot more ReadyBoost activity.
You’ll also notice that activity shows spikes and dips in the graph for your USB flash drive. In my example, that’s the Disk 1 (D:) graph in the bottom-right of the window.
On the flip side, when you close your application(s) you’ll see the amount of data being handled by ReadyBoost steadily dwindle. You may even notice that the ReadyBoost.sfcache file drop completely off the Disk Activity panel.
However, if you fire up that application again, ReadyBoost will come back to life.
SEE: 10 quick tips to make Windows 10 work the way you want
Using Performance Monitor
While Resource Monitor shows that ReadyBoost is actively writing and reading data from its cache, you can get more concrete data with Performance Monitor. Performance Monitor allows you to view performance data or counters, both in real time and from log files. You can view performance data in graph, histogram, and report form. To help you monitor ReadyBoost, Performance Monitor provides a special set of counters under the heading ReadyBoost Cache.
To launch Performance Monitor, press [Windows]+R, type perfmon.exe in the Open text box, and press [Enter]. Once the tool launches, expand the Monitoring Tools branch, if necessary, and click on Performance Monitor. When the graph appears, as shown in Figure B, you’ll see that in its default configuration, Performance Monitor is configured to monitor Processor Time. Since we won’t need this for the task at hand, the first order of business is to click the Red X or Delete Key icon.
Figure B
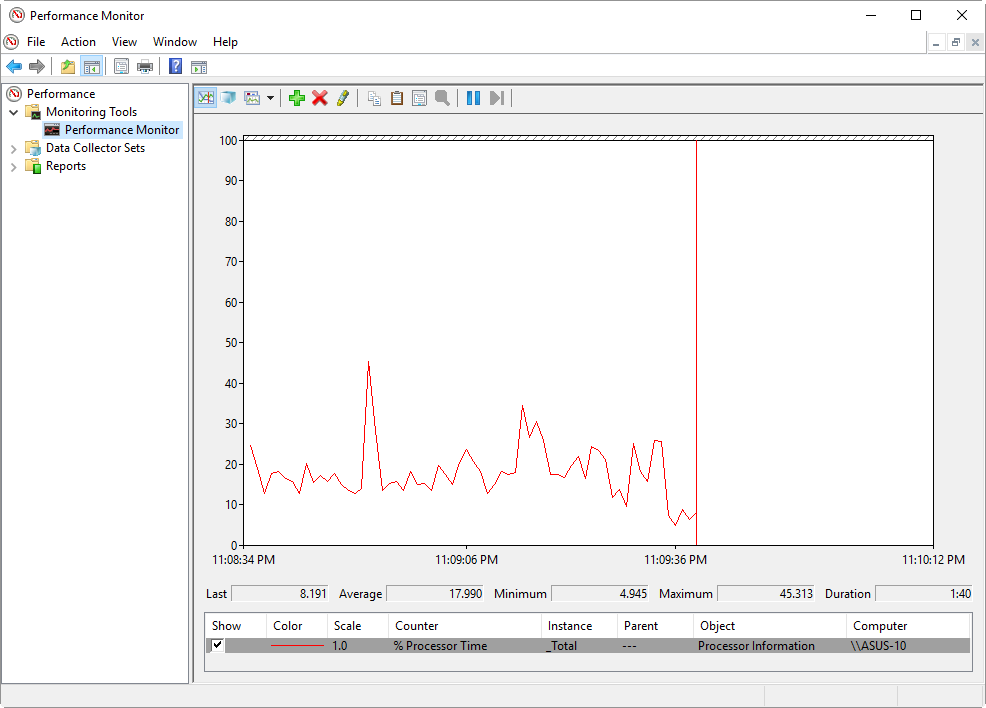 By default, Performance Monitor is configured to monitor Processor Time.
Now, click the Green + or Add icon. When you see the Add Counters dialog box, locate and select the ReadyBoost Cache header and click the Add button. When the ReadyBoost Cache header appears in the Added Counters section, as shown in Figure C, click OK.
Figure C
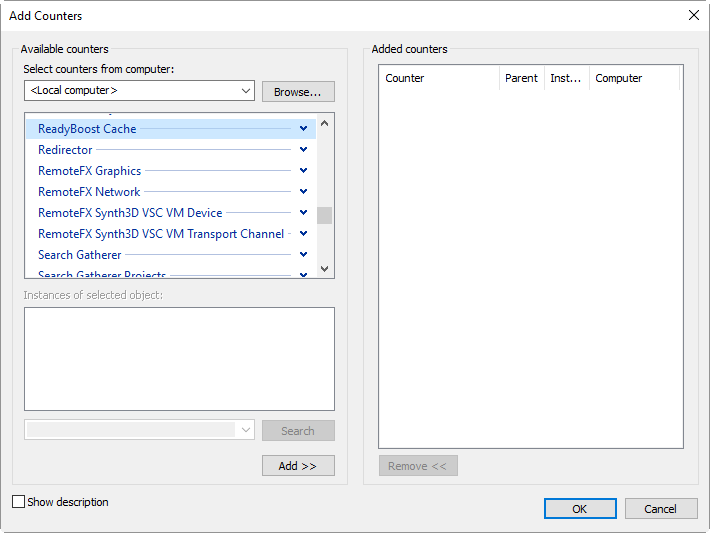
When the ReadyBoost Cache counter appears in the Added Counters section, click OK.
When you add the ReadyBoost Cache header to Performance Monitor, you are actually adding a set of 10 counters to the monitor, as shown in Figure D. These counters are listed and described in Table A.
Figure D
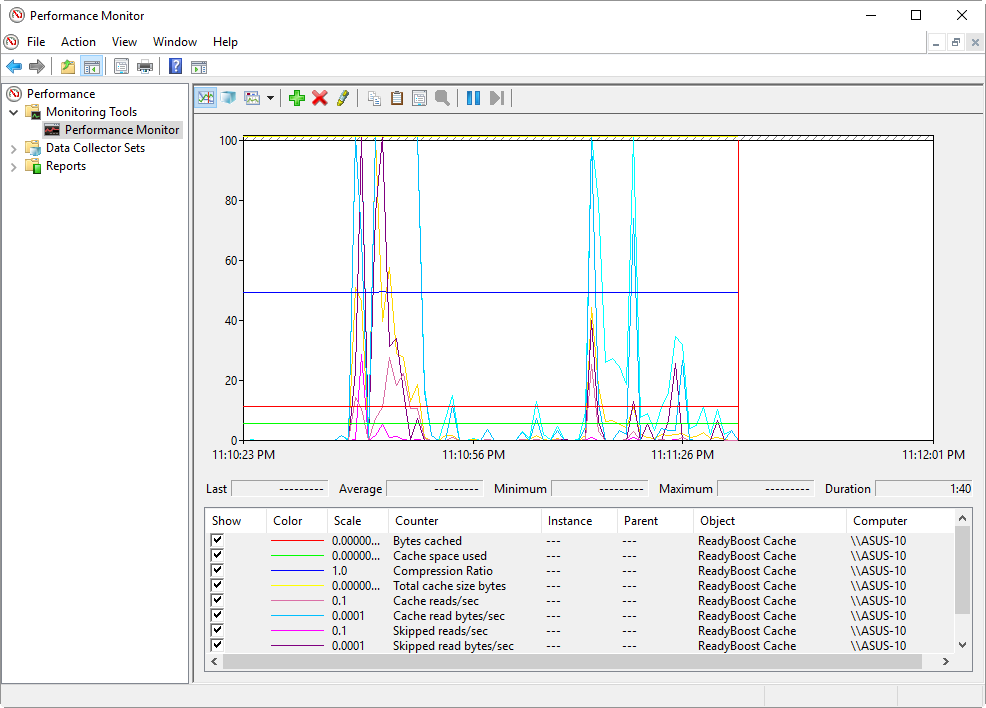
When you add the ReadyBoost Cache header to Performance Monitor, you are adding a set of 10 counters.
Table A
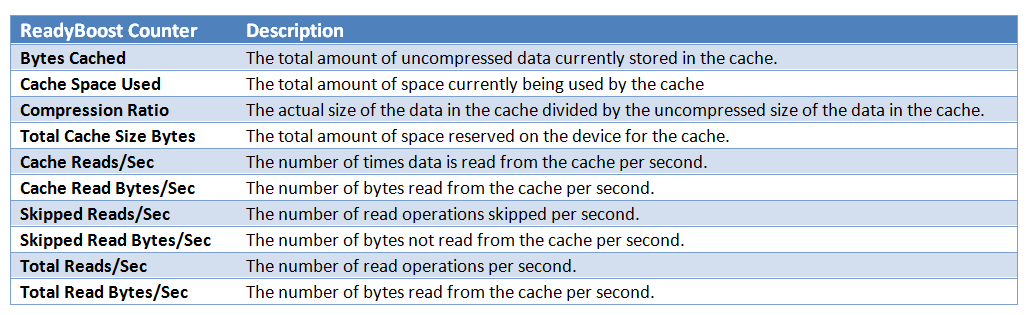
As you can see, having 10 counters on the monitor at one time can be a bit confusing. Furthermore, these counters monitor the full spectrum of ReadyBoost’s activities and not all of them are pertinent when measuring performance gains. As such, you will want to whittle down the counters to just the ones that give you a good view of what’s happening.
For example, what I really want to know is how much the ReadyBoost cache is being used to deliver data, so I chose Cache Reads Bytes/Sec, Cache Reads/Sec, Skipped Reads /Sec, and Skipped Reads Bytes/Sec. The first two counters will help you see how much data is being delivered from the cache. To balance this view I also want to know often ReadyBoost is deferring to the hard disk for reading data from the cache. So I also chose Skipped Reads /Sec and Skipped Read Bytes/Sec.
I then changed the Graph Type from Line to Histogram Bar, as shown in Figure E.
Figure E
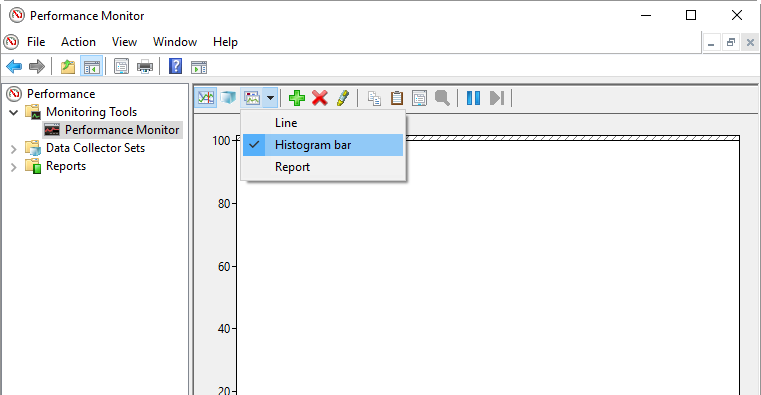
To best see how ReadyBoost performs in real time, change the Graph Type from Line to Histogram Bar.
Now launch an application that will perform a lot of disk activity, reading and writing data to and from the hard disk. In my test, I again launched Microsoft Edge, which immediately began reading and writing data. When I returned to Performance Monitor, I discovered that there was a lot of activity displayed on the graph, as shown in Figure F.
Figure F
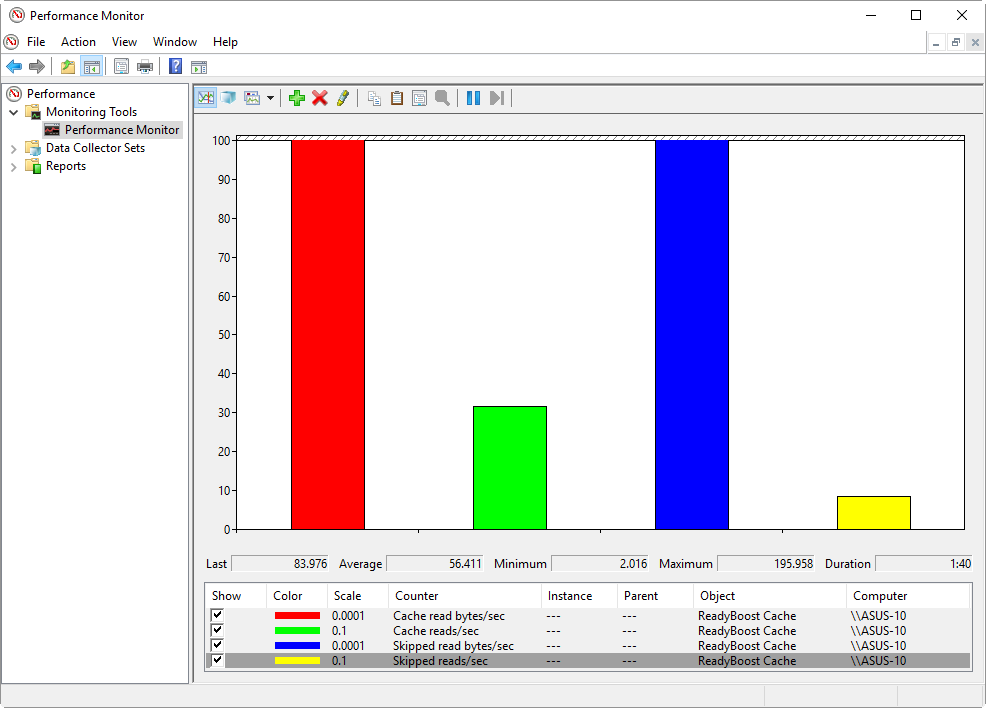
After launching an application that performs a lot of disk activity, you’ll be able to see how much ReadyBoost is contributing to the system.
If you look closely, you’ll see that the amount of data being read from the ReadyBoost cache is roughly equal to the amount of data being read from the hard disk cache. However, this is but a snapshot of ReadyBoost in action under a specific operation. To really gauge how much and under what circumstances ReadyBoost is benefiting your system, you’ll want to configure Performance Monitor to create a log file over a period of time. For instance, you might want to log ReadyBoost activity over a period of a couple of hours during which you perform the types of tasks that regularly use your system.
SEE: How to use custom views in Windows 10’s Event Viewer
Creating a Data Collector Set
If you want to log ReadyBoost activity over a period of time, you’ll need to create a Data Collector Set. Fortunately, doing so is pretty easy once you know the steps.
To begin, change the Graph Type to Line. Next, expand the Data Collector Sets branch in the Performance Monitor navigation pane. Then, right-click User Defined, select New, and click Data Collector Set. When the Create New Data Collector Set wizard appears, enter a name for the set and select the Create Manually option button, as shown in Figure G. Then click Next.
Figure G
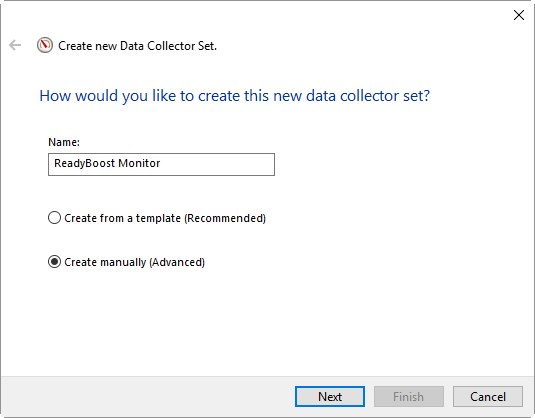
This wizard will walk you through the steps of creating a Data Collector Set.
Now select the Performance Counter check box. On the next page use the Add button to access the Add Counters dialog box, where you can individually select the four pertinent counters. These steps are condensed in Figure H.
Figure H
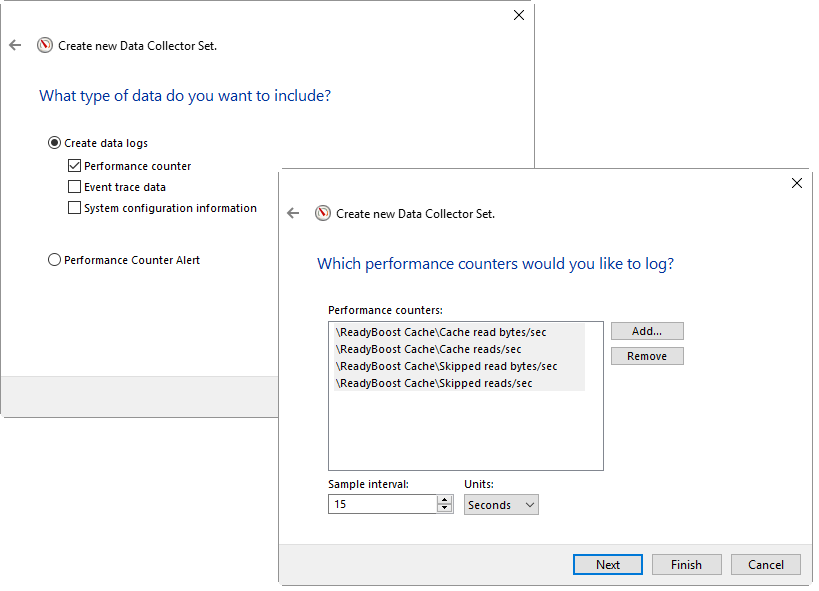
You’ll work through the next two steps in the wizard to add the pertinent counters to your ReadyBoost Monitor Data Collector Set.
Even though there are other settings, click the Finish at this point to complete the wizard. When you return to the Performance Monitor window, you’ll see your ReadyBoost Monitor Data Collector Set. When you are ready to begin logging ReadyBoost activity, just click the green Play icon, shown in Figure I.
Figure I
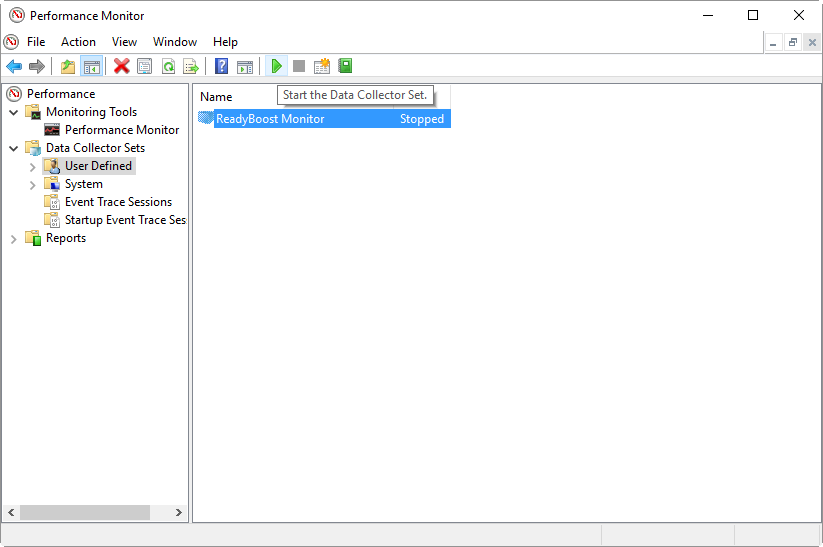
To begin logging ReadyBoost activity, just click the green Play icon.
When you have used your system for what you would consider a substantial amount of time, you can open you Data Collector Set and view the log. To do so, click the Stop icon and then select Performance Monitor in the navigation pane. Click the View Log Data icon to open the Performance Monitor Properties dialog box. Click the Add button, and you can locate and select your log file, as shown in Figure J.
Figure J
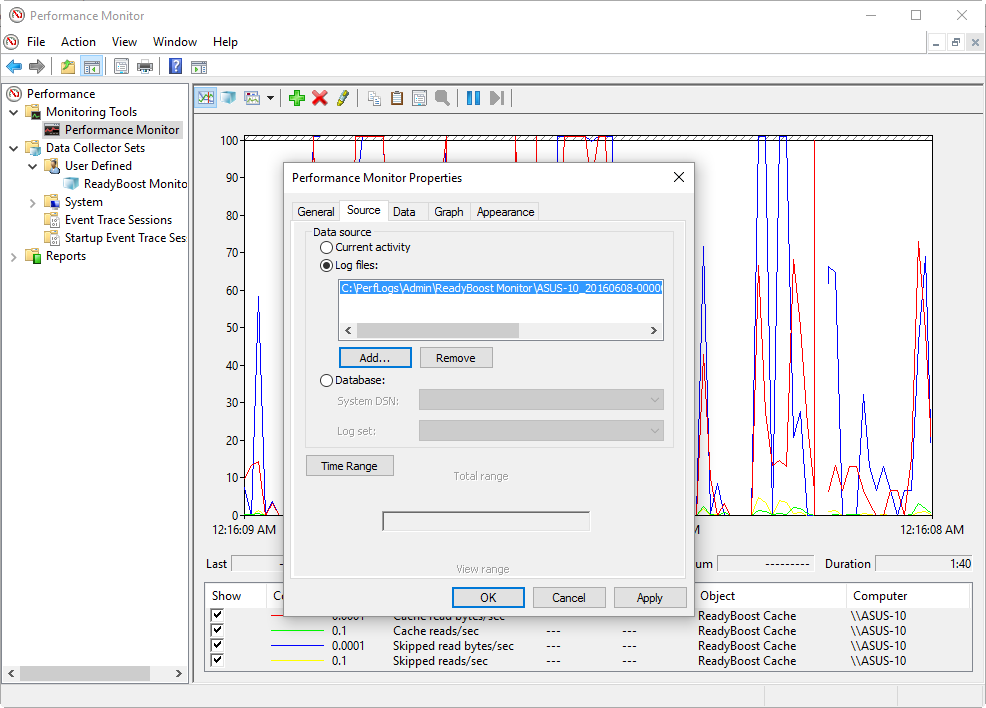
Click the Add button to locate and select your ReadyBoost Monitor log file.
When you click OK, you’ll see your log file and can check on how ReadyBoost behaved during your test period. In Figure K you can see that you can click on the timeline to see how ReadyBoost performed over time. As you do so, you can select any one of the counters and check out the values in the Average, Minimum, and Maximum boxes.
Figure K
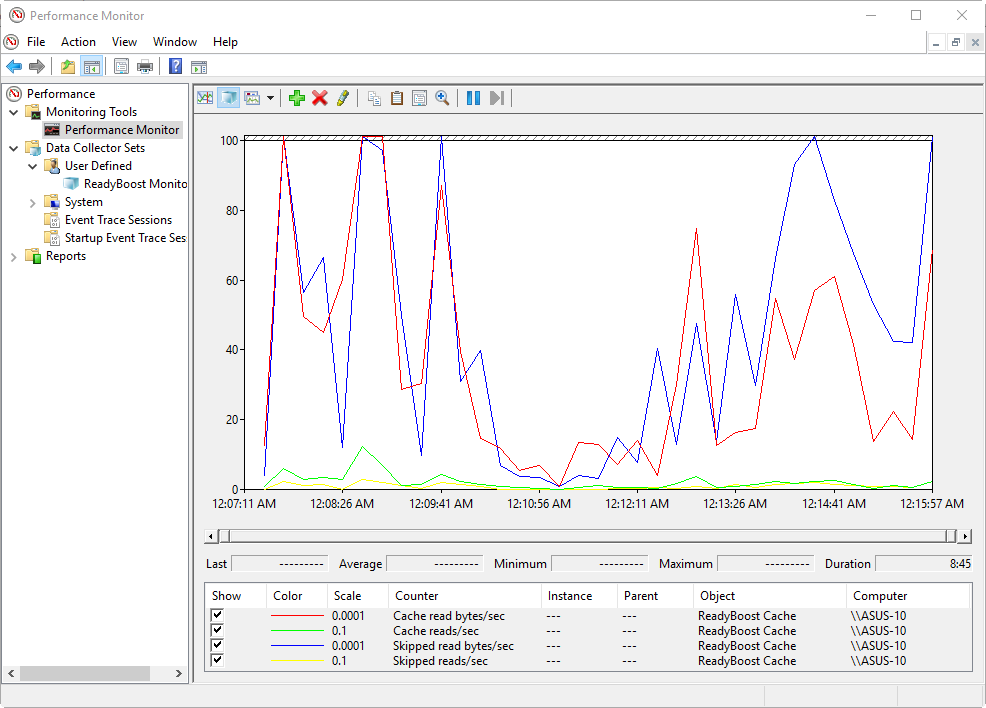
You can click on the timeline to see how ReadyBoost performed over time.
You’ll most likely want to conduct multiple tests under various usage circumstances to get a real handle on how much ReadyBoost benefits your particular system. As always, keep in mind that your mileage may vary.
What’s your take?
Have you tried monitoring ReadyBoost activity? Are you satisfied with the results? Share your findings with fellow TechRepublic members.
Also read…
- Be prepared: Create a Windows 10 Recovery Drive
- Rescue an ailing system: Launch Windows 10 Startup Repair from the Recovery Drive
- How to revive your Windows 10 installation with System Image Recover
- 10 PowerShell commands to make remote management easier
- Microsoft SQL Server 2016 promises more efficient analytics