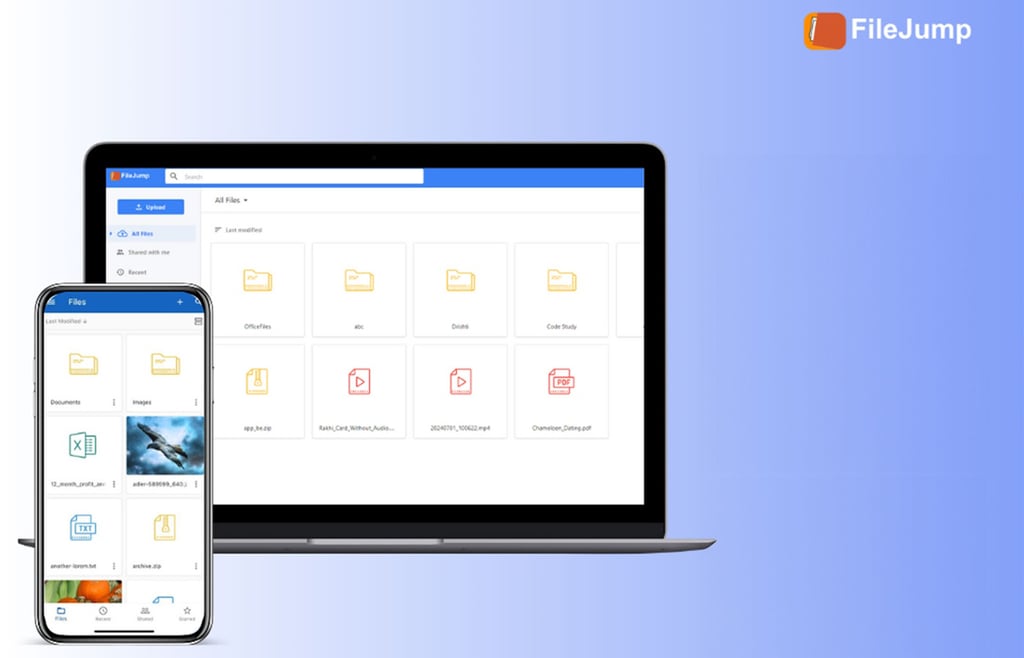
It’s not surprising that many of Microsoft’s own services are built on Azure, but increasingly Microsoft is also offering Azure services as a way for customers to extend and customise products.
When you use dataflows to extract, clean and transform data that you’re loading into Power BI, that data is stored in Azure Data Lake. You could also use it in Azure Databricks or for analytics through Azure SQL Data Warehouse, which you can do through the Azure portal, or make interactive using the Power BI Desktop app.
The automated machine learning in Power BI is the AutoML feature from Azure Machine Learning, which looks at what you’re trying to predict and what data you have available, and iterates through multiple machine-learning algorithms to discover which gets the best score. Or you can take advantage of Azure Cognitive Services to analyse the data in images and text, or build your own machine-learning models and run them.
SEE: Microsoft Power BI: Getting started with data visualization (free PDF) (TechRepublic)
Power BI also now has built-in AI-powered visualisations like Key Influencers, which runs different statistical analyses like logistical regression or classification on the data to extract the key factor associated with a particular outcome. You drag the factors you think are important into the visualisation and Power BI ranks them. As you add more factors that you think might be relevant, or drill into a specific segment, it keeps re-running the model to see if more information reveals anything new.
So if you are analyzing which visitors come back to your hotel to stay again, the Key Influencer might be which country they’re from. But if you select visitors in a certain age group the model runs on just that slice of data, where the Key Influencer might be whether they ate in the hotel restaurant or had a spa treatment. If you’re looking at shipping delays, you can add factors like which division sent the delivery, what factory it came from, or what area it was being sent from to see what has the most effect on what arrives on time and what’s delivered late.
There are two new AI visualisations. Distribution Change looks for what makes one data distribution different from another. The Decomposition Tree sends multiple queries to the Power BI model and then links them together so you can click on a metric in a visualisation to see what’s behind it, and then keep clicking down to the different levels of data to understand it in depth. That way, you can see if those 500 sales in one city are driven by a particular group of customers or many different customers who still have something in common.
All of this can feed into the visualisations, dashboards and natural-language Q&A features that Power BI is known for, as well as the new paginated reports that previously required SQL Server. For example, when you use the automated machine learning, the prediction for each row includes details of what contributed to the prediction, so you could include the explanation in a report to clarify where the figures come from and what factors appear to be involved.

Data pros
Power BI has different paths for doing this, depending on whether you’re a data scientist who wants to make their work available to the rest of the business, or an analyst who wants to use machine learning but doesn’t have the skills to do it themselves.
Data scientists can add steps to a dataflow to extract information from unstructured data like images or text from tweets or reviews, by extracting keywords, doing sentiment analysis or detecting what’s in a photograph. That’s powered by Cognitive Services, but without the usual steps of writing the code to call the API — you can just add the image and text analytics to the dataflow.
As new Cognitive Services come out, Power BI will add more of these features. The latest are extracting text from images, handwriting recognition and entity recognition — not just extracting keywords, but classifying what they refer to. If you’re a hotel owner looking at reviews on the internet, entity recognition can tell you whether ‘cycling’ in a review means a happy guest who stayed when they were on a cycling trip or an unhappy guest complaining about the air conditioning cycling on and off all night.
If you’re creating your own machine-learning models in Azure Machine Learning and publishing them as a web service, you can give Power BI analysts in your organisation role-based access to them through the Azure portal, and then they’ll show up as models they can use in the same way as Cognitive Services. If you want to analyse the photos in those hotel reviews, you might need to train a custom image recognition model to understand pictures of the things you find in a hotel. Photos of air conditioners, light bulbs, windows and lifts in a hotel review are probably a bad sign, and the standard image recognition model might not highlight them as being important objects.
SEE: Microsoft Power BI: Data analytics goes mainstream (Tech Pro Research)
And if you’re building your own machine-learning model and using Python and R to integrate that into Power BI, or using the AutoML in Power BI to have it discover what machine-learning algorithm works best with your data, you can now upload those models to Azure Machine Learning to manage them or tune them further. That means business analysts could use the automated option, and if it proves useful a data scientist could pick it up and develop it further.
And all of these insights are available to use in a range of ways. Powerful as the interactive dashboards and visualisations in Power BI are, sometimes what business users want is the familiar report that they can print out and read, or email to a customer or supplier. Power BI now supports the same paginated reports with headers and footers and table, chart or matrix layouts as SQL Server Reporting Services (with a new Report Builder tool to create them). Paginated reports are part of Power BI Premium, but they’re also compatible with the on-premises Power BI Report Server.
So if you want to move your analytics from SQL Server Reporting Services to Power BI, you can create an enterprise business intelligence system that gives you the full range of business analytics, from the reports your organization probably already depends on, to machine learning that tries to automatically find insights in data that isn’t necessarily structured or numerical. If Power BI doesn’t fit your needs on its own, the idea is to make it so easy to extend with Azure that business users can do it themselves.
More on Power BI and Microsoft
- Microsoft’s Power BI Premium delivers enterprise-grade features and bulk discounts (ZDNet)
- Datazen acquisition could bring Microsoft Power BI to iOS and Android (TechRepublic)
- Building A Bank that can Surprise and Delight with Power BI (TechRepublic Resource Library)
- Create data visualizations and analytics with Google Fusion Tables (TechRepublic)
- Microsoft Office 365: The smart person’s guide (TechRepublic)